Voronoi Example
Grid was taken from flopy/docs/Notebooks/dis_voronoi_example.py.
This notebook shows how nlmod can be used to build and visualize models on a voronoi grid.
This notebook does not describe how to build a Voronoi grid, refer to flopy’s documenation for more information on that topic.
from pathlib import Path

import pandas as pd
import xarray as xr

import nlmod
model_ws = Path("../../tests/data/mf6output/voronoi")
This rebuilds the original model.
ds = nlmod.grid.modelgrid_to_ds(grbfile=model_ws / "voronoi.disv.grb")
ds.attrs["exe_name"] = "mf6"
ds.attrs["model_name"] = "voronoi"
ds.attrs["model_ws"] = str(model_ws)
ds.attrs["mfversion"] = "mf6"
edge_mask = nlmod.grid.mask_model_edge(ds)["edge_mask"]
ds["kh"] = 10.0 * xr.ones_like(ds["botm"])
ds["kv"] = 10.0 * xr.ones_like(ds["botm"])
ds = nlmod.time.set_ds_time(ds, start="2020-01-01", perlen=[1.0])
sim = nlmod.sim.sim(ds)
tdis = nlmod.sim.tdis(ds, sim)
ims = nlmod.sim.ims(sim)
gwf = nlmod.gwf.gwf(ds, sim)
dis = nlmod.gwf.disv(ds, gwf)
npf = nlmod.gwf.npf(ds, gwf)
ghb = nlmod.gwf.ghb(ds, gwf, bhead=10*edge_mask, cond=1e8 * edge_mask)
ic = nlmod.gwf.ic(ds, gwf, starting_head=10.0)
df = pd.DataFrame(index=["well1"], columns=["x", "y", "top", "botm", "Q"])
df.loc["well1"] = 1500, 500, 0.0, -10.0, -200.0
wel = nlmod.gwf.wells.wel_from_df(df, ds=ds, gwf=gwf)
oc = nlmod.gwf.oc(ds, gwf)

# uncomment to build and run the simulation
# nlmod.sim.write_and_run(ds, sim)
Intersecting with grid:   0%|          | 0/1 [00:00<?, ?it/s]
Intersecting with grid: 100%|██████████| 1/1 [00:00<00:00, 130.19it/s]
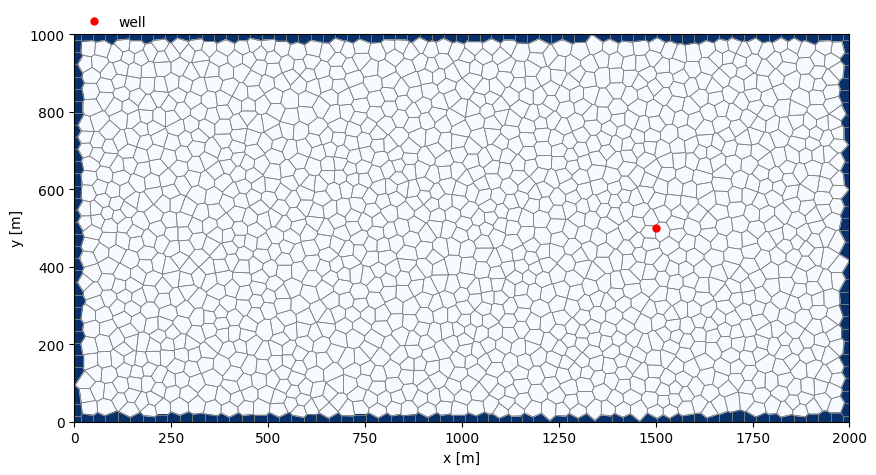
Plot the model grid and the GHB and WEL locations.
ax = nlmod.plot.modelgrid(ds, linewidth=0.5)
nlmod.plot.data_array(edge_mask.isel(layer=0), ds=ds, cmap="Blues", ax=ax)
ax.plot(df.x, df.y, "ro", markersize=5, label="well")
ax.set_xlabel("x [m]")
ax.set_ylabel("y [m]")
ax.legend(loc=(0, 1), frameon=False, ncol=1);
Load the heads
hd = nlmod.gwf.output.get_heads_da(ds)
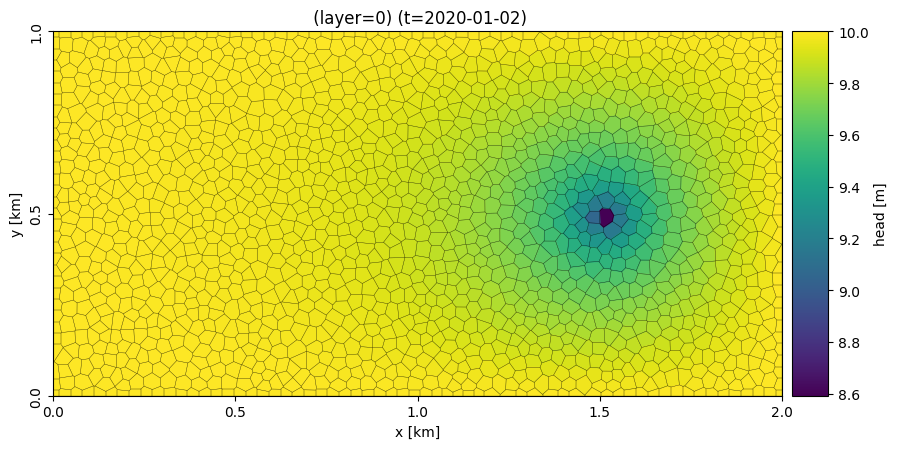
Plot the results
ax = nlmod.plot.map_array(
    hd, ds, xlabel="x [km]", ylabel="y [km]", colorbar_label="head [m]"
)