Resampling raster data
Resampling data is a very common operation when building a Modflow model. Usually it is used to project data from one grid onto the other. There are many different ways to do this. This notebook shows some examples of resampling methods that are incorporated in the nlmod package. These methods rely heavily on resampling methods in packages such as rioxarray and scipy.interpolate.
import geopandas as gpd
import matplotlib.pyplot as plt
import numpy as np
import xarray as xr
from matplotlib.colors import Normalize
from scipy.interpolate import RectBivariateSpline
from shapely.geometry import LineString, Point

import nlmod
from nlmod import resample
nlmod.util.get_color_logger("INFO")
nlmod.show_versions()
Python version     : 3.11.14
NumPy version      : 2.4.4
Xarray version     : 2026.4.0
Matplotlib version : 3.10.9
Flopy version      : 3.10.0

nlmod version      : 0.11.3dev
Grid types
Two different gridtypes are supported in nlmod:
structured grids where the cellsize is fixed for all cells
vertex grids where the cellsize differs locally. These grids are usually created using local grid refinement algorithms.
In this notebook we define a few xarray DataArrays of structured and vertex grids. We use these grids in the next section to show the resampling functions in nlmod.
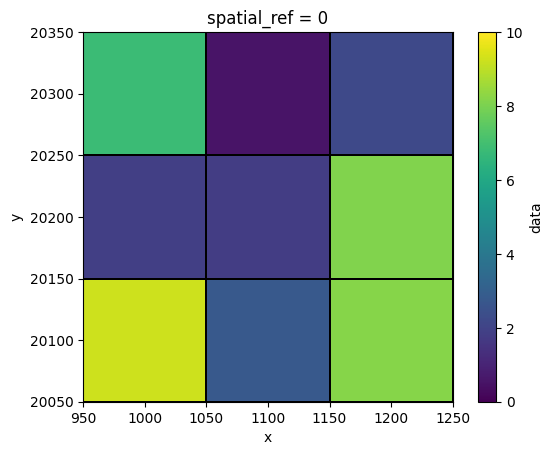
structured grid
This structured grid consits of 3 x 3 cells, and has random numbers between 0 and 9.
ds = nlmod.get_ds([950, 1250, 20050, 20350], delr=100)
rng = np.random.default_rng(123)
ds["data"] = ("y", "x"), rng.random((len(ds.y), len(ds.x))) * 10

norm=Normalize(0, 10)
fig, ax = plt.subplots()
ax.set_aspect("equal")
ds["data"].plot(ax=ax, lw=0.1, edgecolor="k", norm=norm);
INFO:nlmod.dims.base.to_model_ds:resample layer model data to structured modelgrid
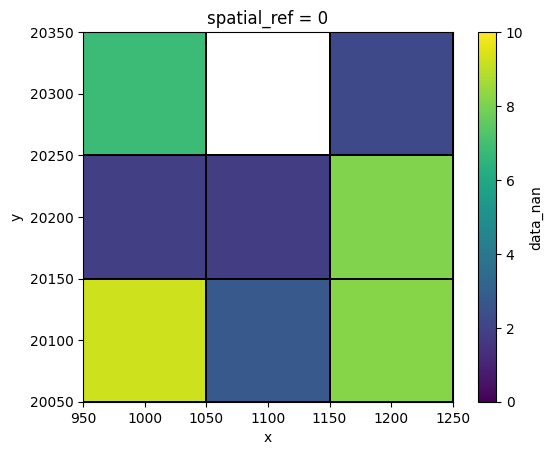
structured grid with nan value
ds["data_nan"] = ds["data"].copy()
ds["data_nan"].data[0, 1] = np.nan

fig, ax = plt.subplots()
ax.set_aspect("equal")
ds["data_nan"].plot(ax=ax, lw=0.1, edgecolor="k", norm=norm);
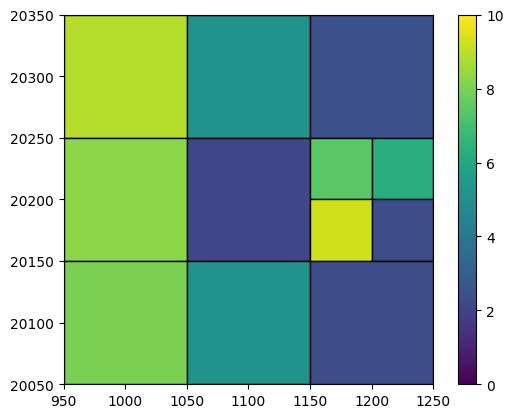
vertex grid
dsv = nlmod.grid.refine(
    ds, refinement_features=[([Point(1200, 20200)], "point", 1)], model_ws="07_resampling"
)
dsv["data"] = "icell2d", rng.random(len(dsv.data)) * 10

fig, ax = plt.subplots()
ax.set_aspect("equal")
pc = nlmod.plot.data_array(dsv["data"], ds=dsv, edgecolor="k", norm=norm)
plt.colorbar(pc);
INFO:nlmod.dims.grid.refine:create vertex grid using gridgen
INFO:nlmod.dims.grid.ds_to_gridprops:resample model Dataset to vertex modelgrid
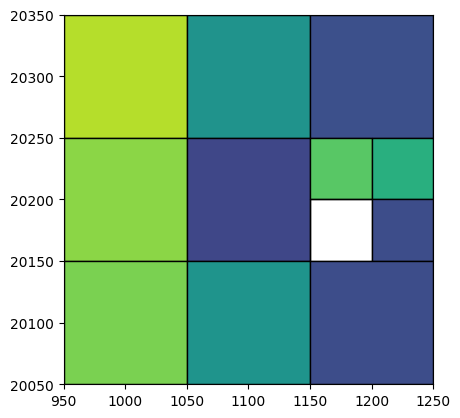
vertex grid with nan
dsv["data_nan"] = dsv["data"].copy()
dsv["data_nan"][7] = np.nan

fig, ax = plt.subplots()
ax.set_aspect("equal")
nlmod.plot.data_array(dsv["data_nan"], ds=dsv, edgecolor="k", norm=norm);
Structured grid to fine structured grid
# generate a finer model dataset
ds_fine = nlmod.get_ds(extent=[950.0, 1250.0, 20050.0, 20350.0], delr=50.0)
INFO:nlmod.dims.base.to_model_ds:resample layer model data to structured modelgrid
def compare_structured_data_arrays(da1, da2, method, edgecolor="k"):
    fig, axes = plt.subplots(ncols=2, figsize=(12, 6))
    da1.plot(ax=axes[0], edgecolor=edgecolor, norm=norm)
    axes[0].set_aspect("equal")
    axes[0].set_title("original grid")
    da2.plot(ax=axes[1], edgecolor=edgecolor, norm=norm)
    axes[1].set_aspect("equal")
    axes[1].set_title(f"resampled grid, method {method}")
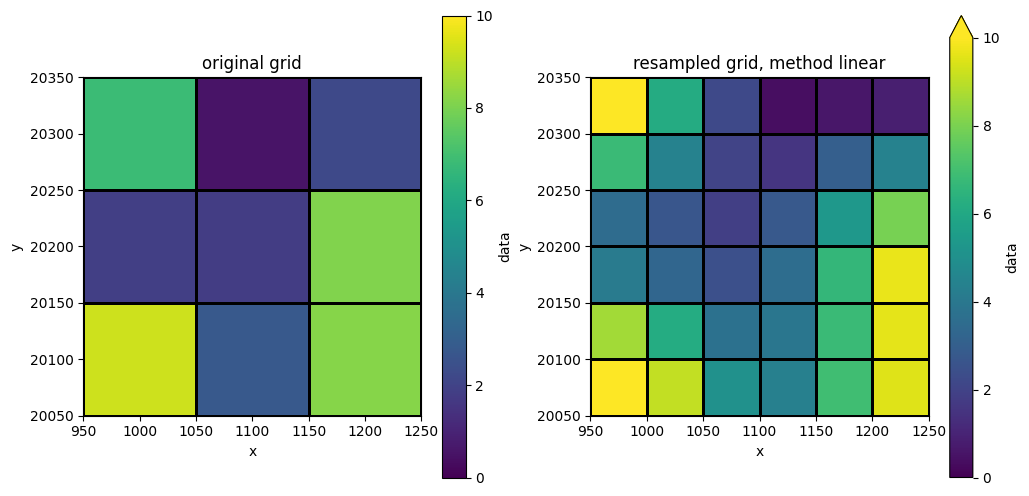
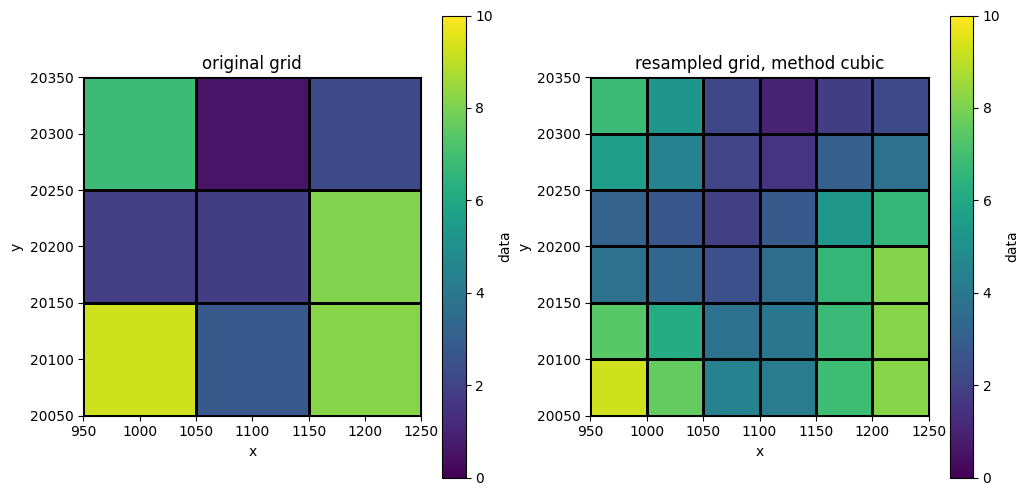
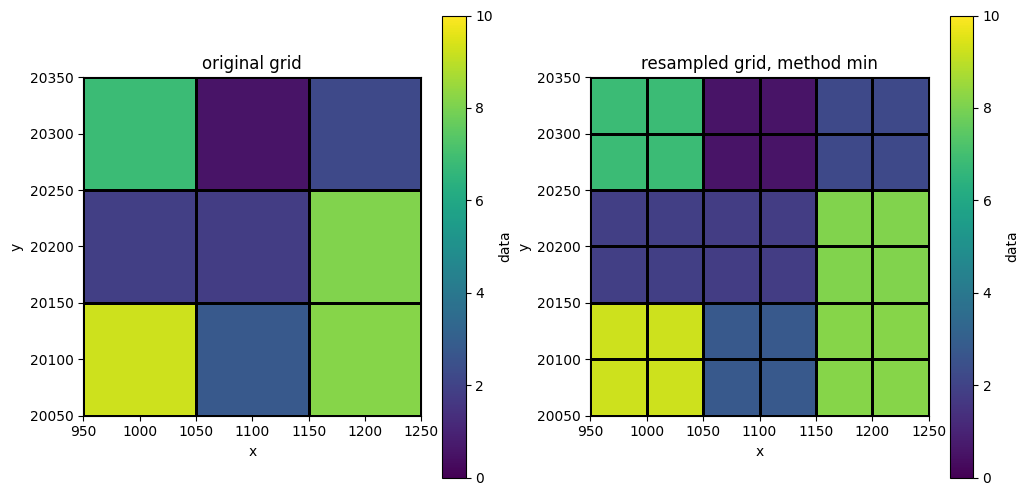
Without NaNs
for method in ["nearest", "linear", "cubic", "average", "min"]:
    struc_out = resample.structured_da_to_ds(ds["data"], ds_fine, method=method)
    compare_structured_data_arrays(ds["data"], struc_out, method)


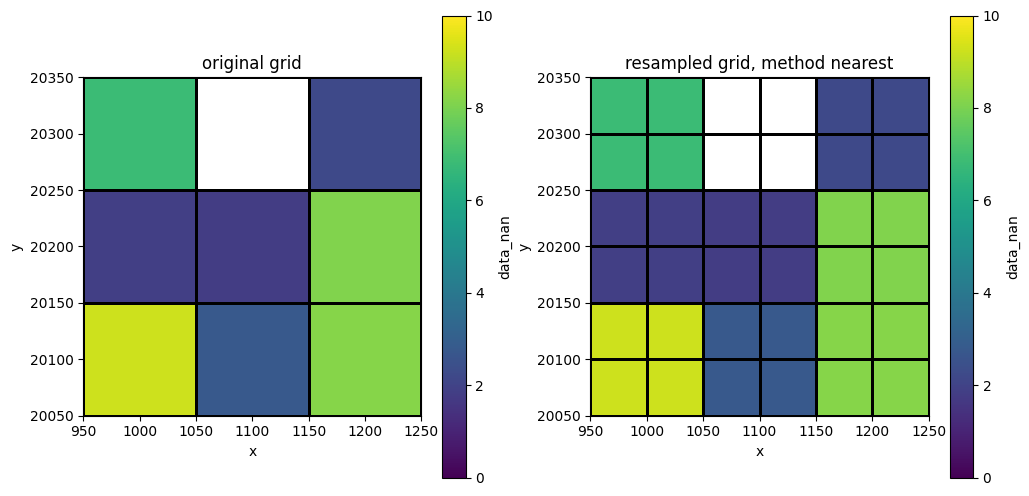
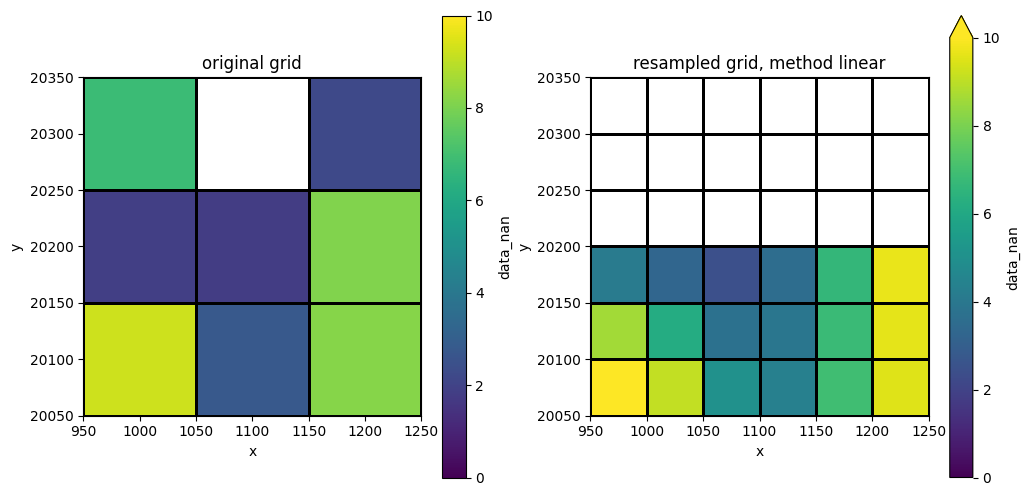
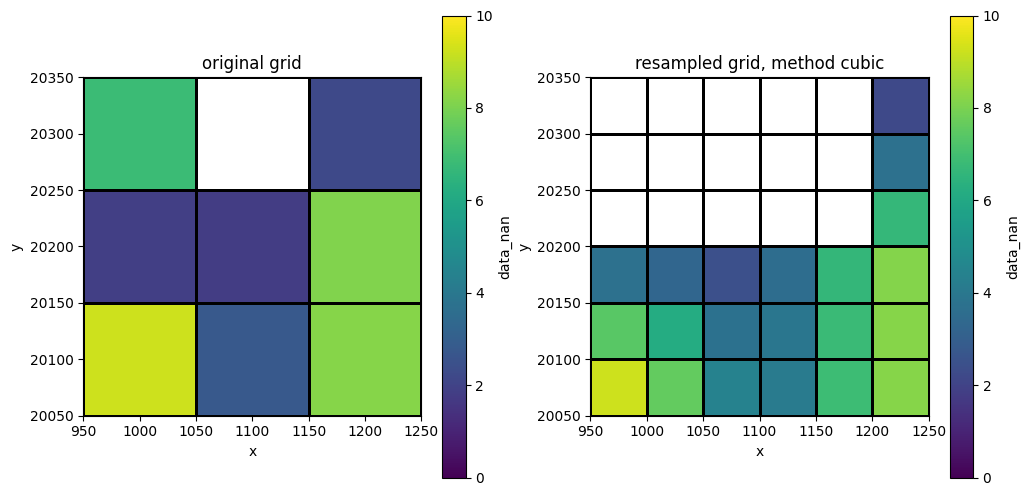
With NaNs
for method in ["nearest", "linear", "cubic", "average", "mode"]:
    struc_out = resample.structured_da_to_ds(ds["data_nan"], ds_fine, method=method)
    compare_structured_data_arrays(ds["data_nan"], struc_out, method)


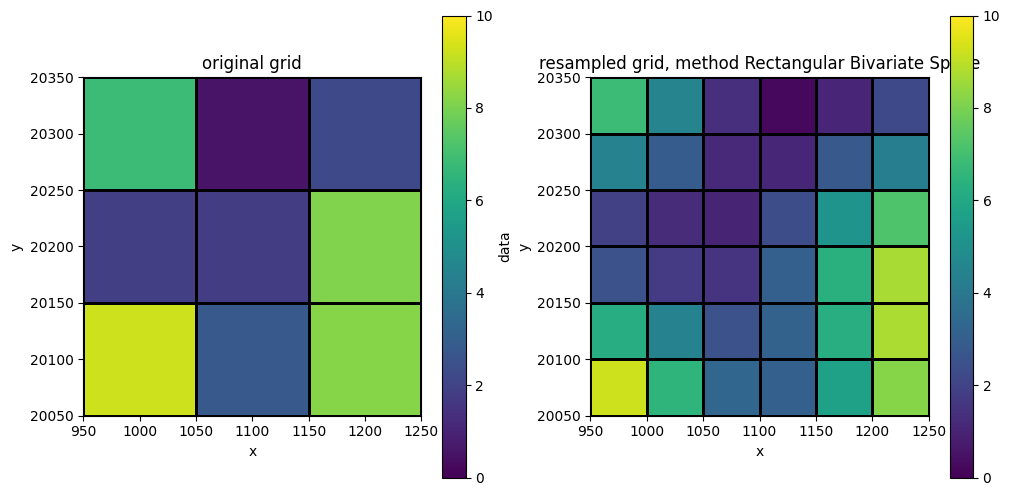
Rectangular Bivariate Spline
Note: not yet included as a method in nlmod
interp_spline = RectBivariateSpline(
    ds.x.values,
    ds.y.values[::-1],
    ds["data"].values[::-1],
    ky=min(3, len(ds.y) - 1),
    kx=min(3, len(ds.x) - 1),
)
arr_out = interp_spline(ds_fine.x, ds_fine.y[::-1], grid=True)[::-1]
struc_out = xr.DataArray(
    arr_out, dims=("y", "x"), coords={"x": ds_fine.x, "y": ds_fine.y}
)
compare_structured_data_arrays(ds["data"], struc_out, "Rectangular Bivariate Spline")
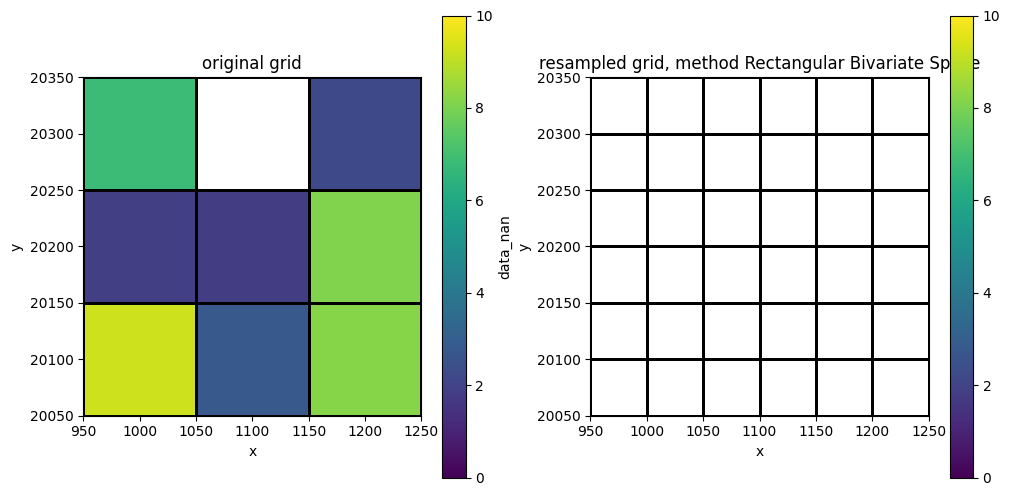
Rectangular Bivariate Spline with nans
Note: not yet included as a method in nlmod
interp_spline = RectBivariateSpline(
    ds.x.values,
    ds.y.values[::-1],
    ds["data_nan"].values[::-1],
    ky=min(3, len(ds.y) - 1),
    kx=min(3, len(ds.x) - 1),
)
arr_out = interp_spline(ds_fine.x, ds_fine.y[::-1], grid=True)[::-1]
struc_out = xr.DataArray(
    arr_out, dims=("y", "x"), coords={"x": ds_fine.x, "y": ds_fine.y}
)
compare_structured_data_arrays(
    ds["data_nan"], struc_out, "Rectangular Bivariate Spline"
)
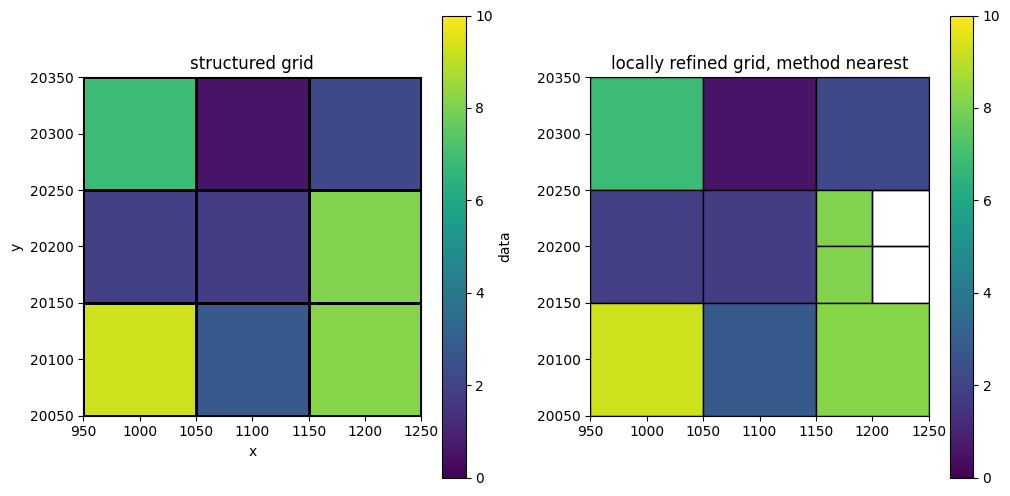
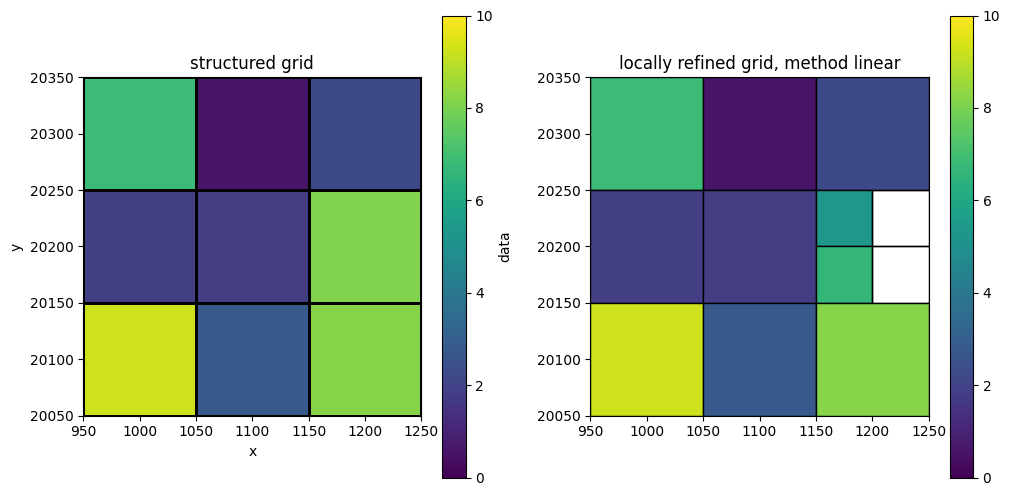
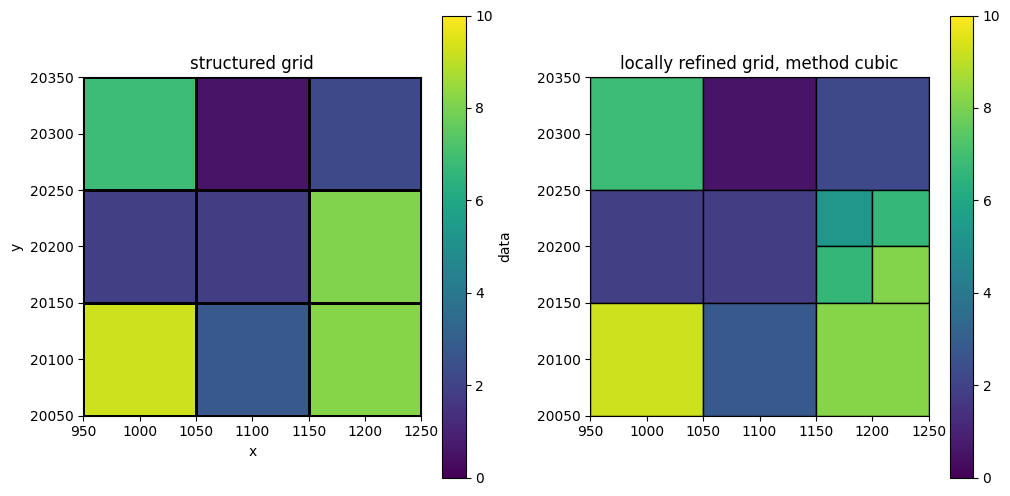
Structured grid to locally refined grid
def compare_struct_to_vertex(struc2d, res_vertex2d_n, dsv, method):
    fig, axes = plt.subplots(ncols=2, figsize=(12, 6))
    struc2d.plot(ax=axes[0], edgecolor="k", norm=norm)
    axes[0].set_aspect("equal")
    axes[0].set_title("structured grid")

    pc = nlmod.plot.data_array(
        res_vertex2d_n, ds=dsv, ax=axes[1], edgecolor="k", norm=norm
    )
    plt.colorbar(pc)
    axes[1].set_aspect("equal")
    axes[1].set_title(f"locally refined grid, method {method}")
WIthout NaNs
for method in ["nearest", "linear", "cubic"]:
    res_vertex2d_n = resample.structured_da_to_ds(ds["data"], dsv, method=method)
    compare_struct_to_vertex(ds["data"], res_vertex2d_n, dsv, method)
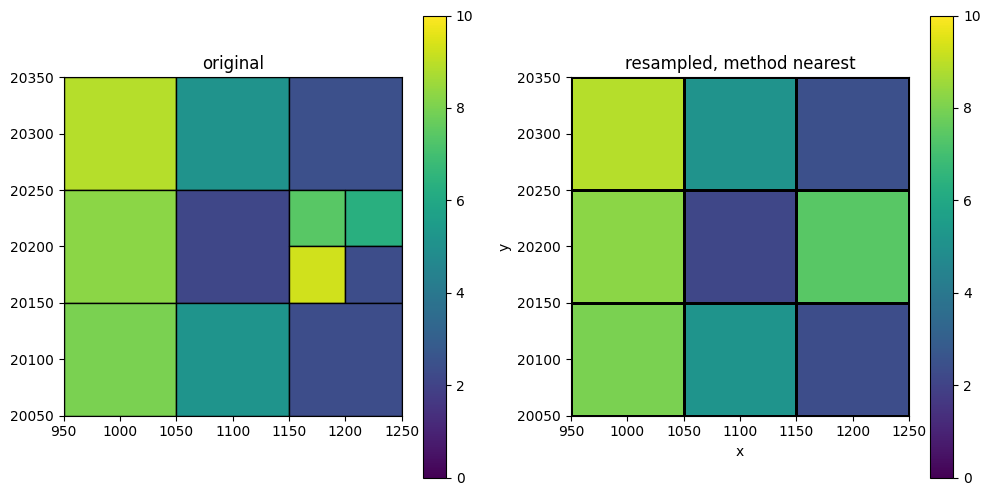
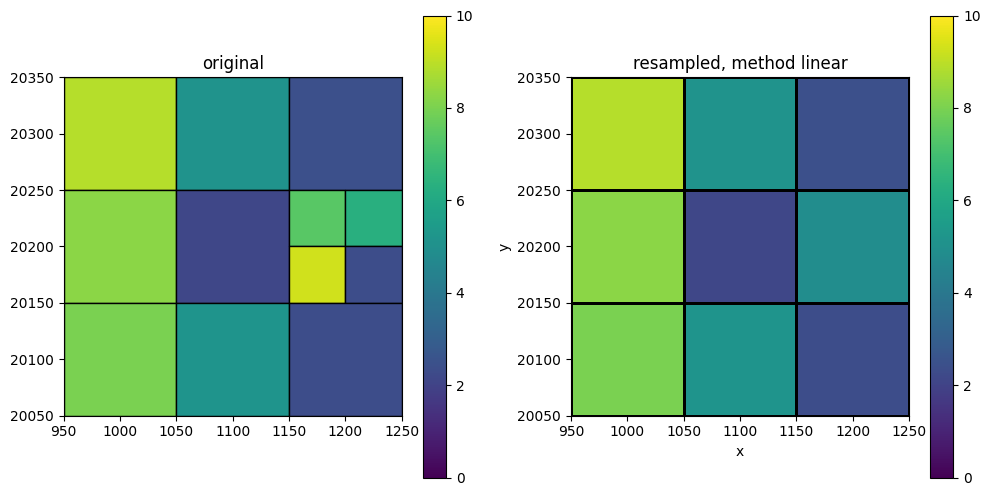
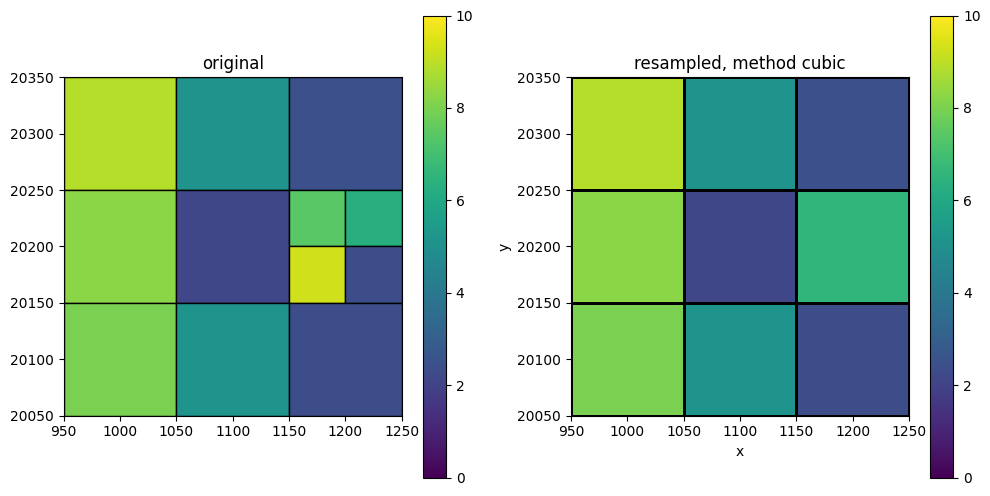
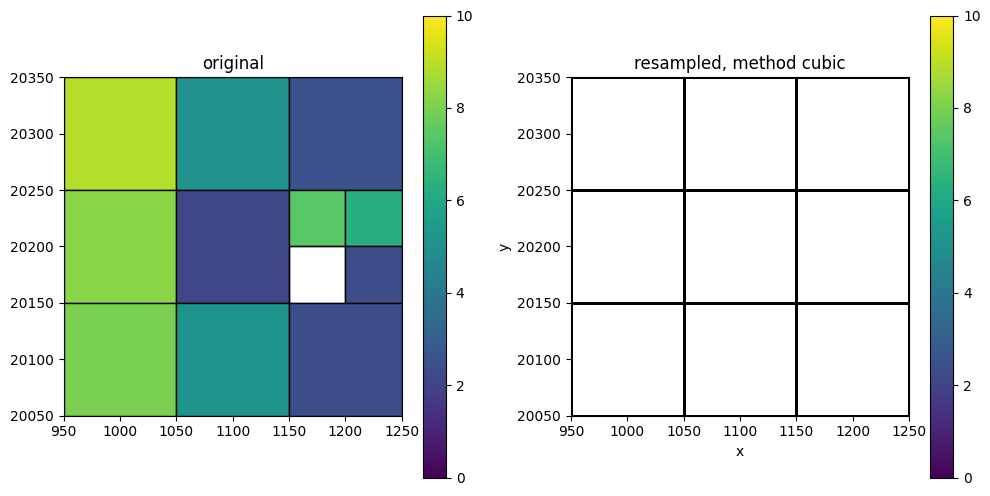
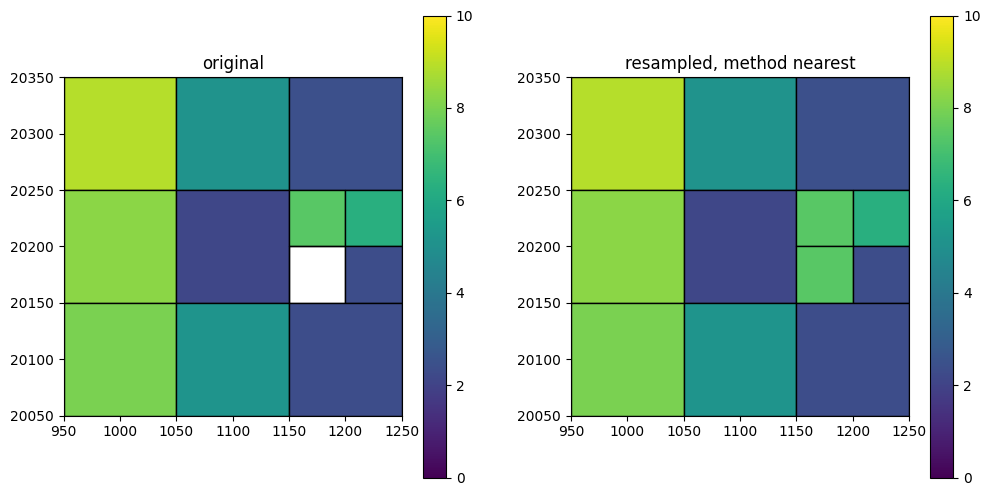
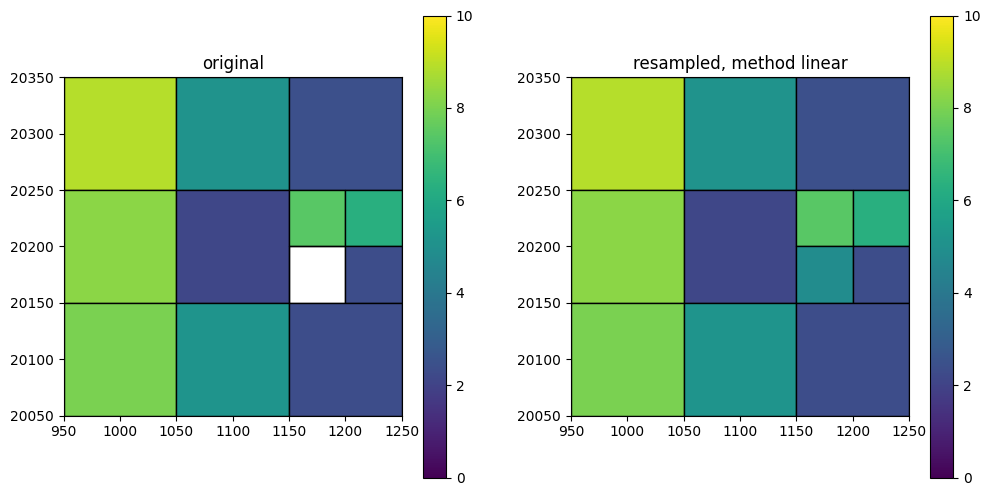
Locally refined grid to structured grid
def compare_vertex_to_struct(vertex1, dsv, struc_out_n, method):
    fig, axes = plt.subplots(ncols=2, figsize=(12, 6))
    pc = nlmod.plot.data_array(vertex1, ds=dsv, ax=axes[0], edgecolor="k", norm=norm)
    plt.colorbar(pc)
    axes[0].set_title("original")
    axes[0].set_aspect("equal")
    struc_out_n.plot(ax=axes[1], edgecolor="k", norm=norm)
    axes[1].set_title(f"resampled, method {method}")
    axes[1].set_aspect("equal")
Without NaNs
for method in ["nearest", "linear", "cubic"]:
    struc_out_n = resample.vertex_da_to_ds(dsv["data"], ds=ds, method=method)
    compare_vertex_to_struct(dsv["data"], dsv, struc_out_n, method)
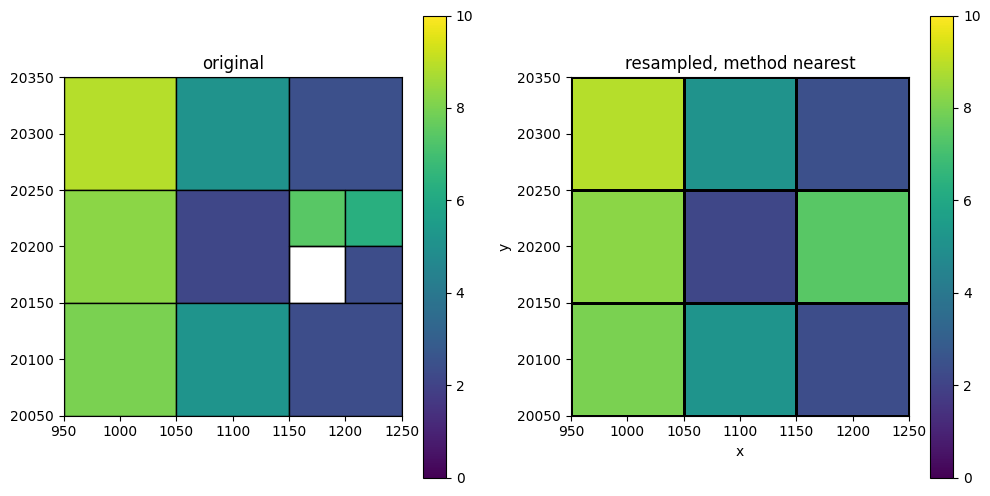
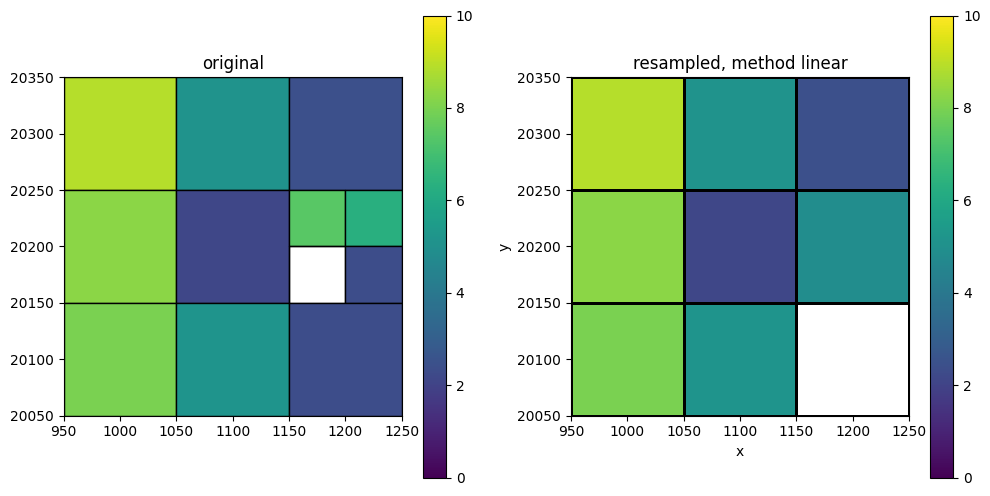
With NaNs
for method in ["nearest", "linear", "cubic"]:
    struc_out_n = resample.vertex_da_to_ds(dsv["data_nan"], ds=ds, method=method)
    compare_vertex_to_struct(dsv["data_nan"], dsv, struc_out_n, method)
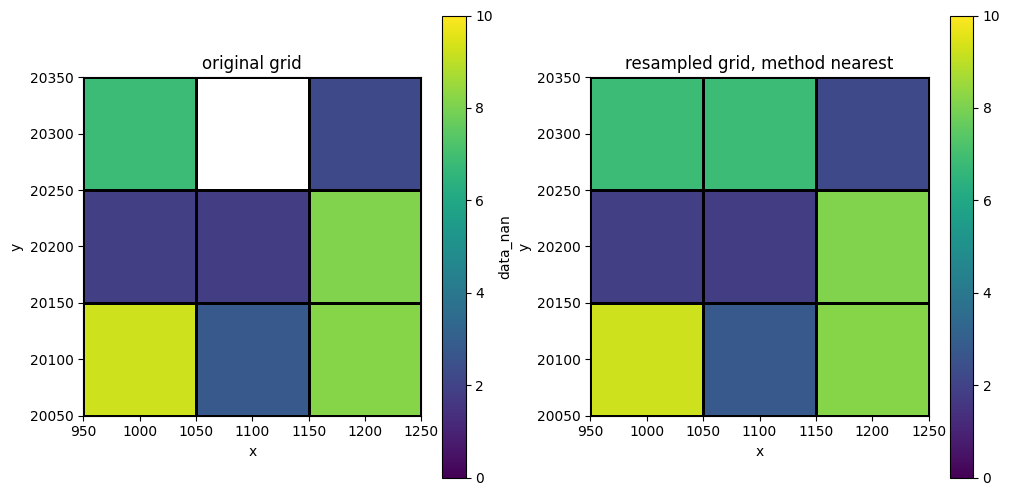
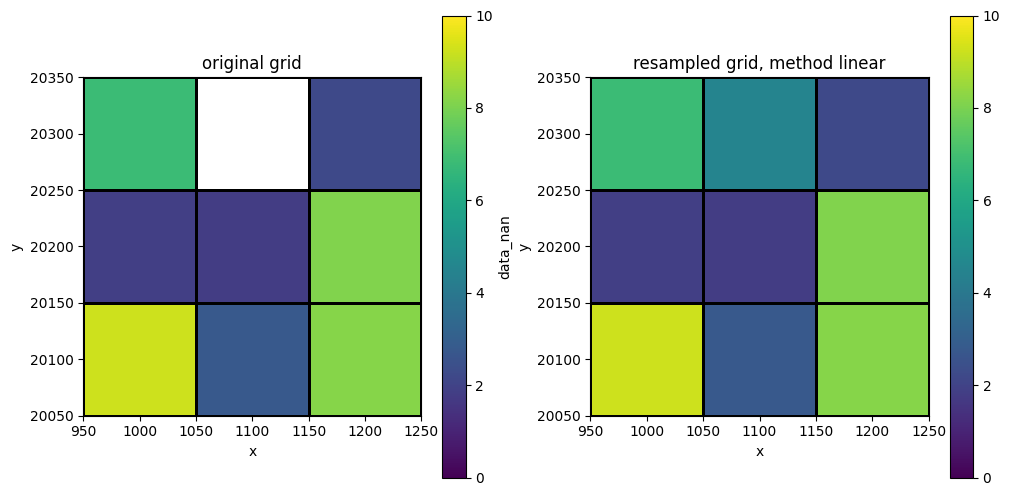
Fill nan values
Structured grid
for method in ["nearest", "linear"]:
    struc2d_nan_filled = resample.fillnan_da_structured_grid(
        ds["data_nan"], method=method
    )
    compare_structured_data_arrays(ds["data_nan"], struc2d_nan_filled, method)
vertex grid
def compare_vertex_arrays(vertex1, vertex2, dsv, method):
    fig, axes = plt.subplots(ncols=2, figsize=(12, 6))
    pc = nlmod.plot.data_array(vertex1, ds=dsv, ax=axes[0], edgecolor="k", norm=norm)
    plt.colorbar(pc)
    axes[0].set_title("original")
    axes[0].set_aspect("equal")
    pc = nlmod.plot.data_array(vertex2, ds=dsv, ax=axes[1], edgecolor="k", norm=norm)
    plt.colorbar(pc)
    axes[1].set_title(f"resampled, method {method}")
    axes[1].set_aspect("equal")
for method in ["nearest", "linear"]:
    vertex1_nan_filled = resample.fillnan_da_vertex_grid(
        dsv["data_nan"], ds=dsv, method=method
    )
    compare_vertex_arrays(dsv["data_nan"], vertex1_nan_filled, dsv, method)
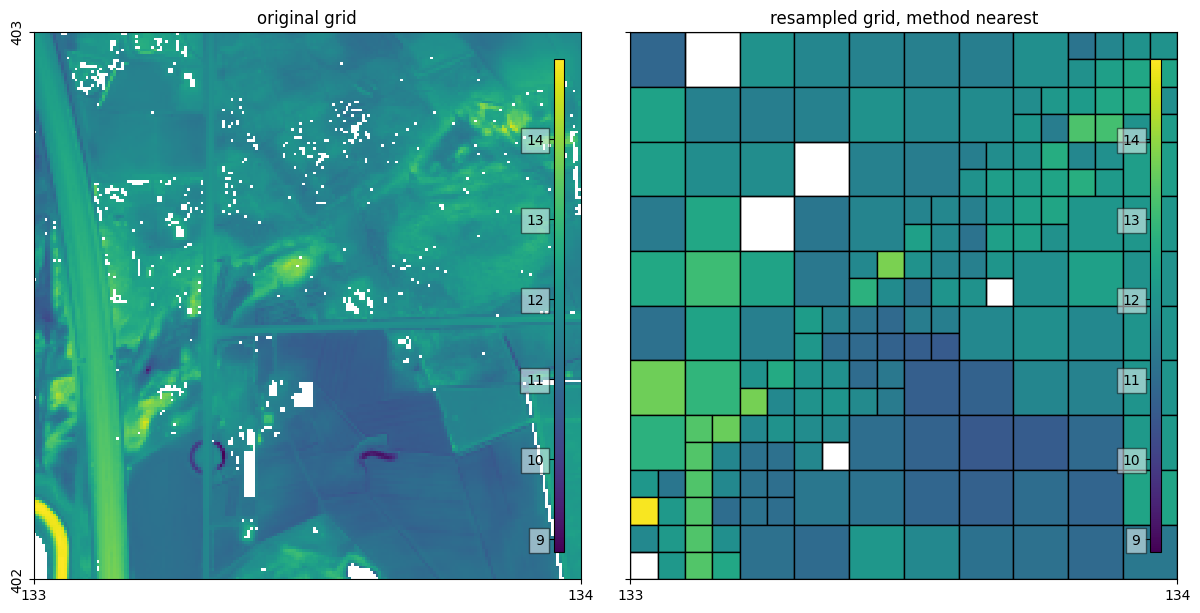
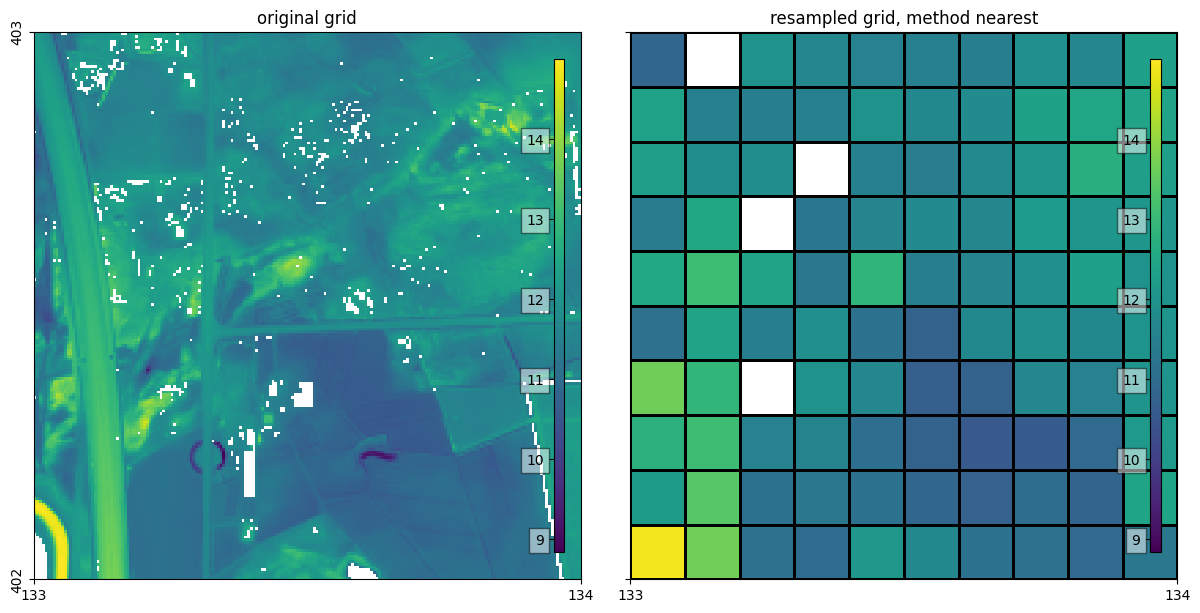
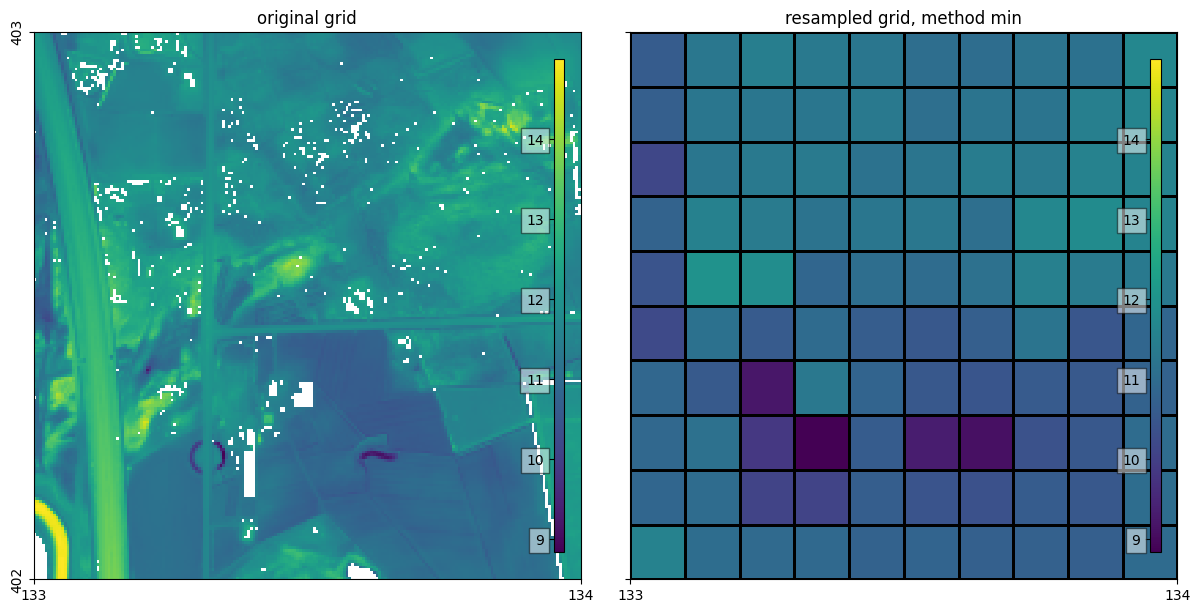
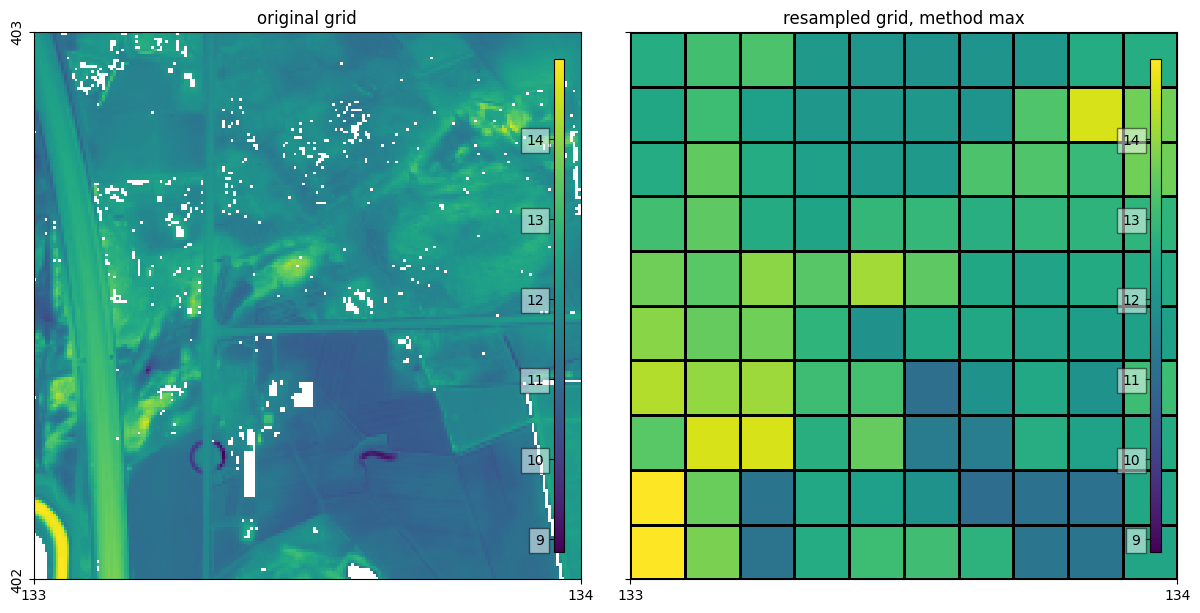
Real world example
In this example we will resample the values of the dutch Digital Terrain Model (DTM) from AHN4 to a structured grid and a vertex grid, using several methods. First we will download the AHN-information.
extent = [133000, 134000, 402000, 403000]
ahn = nlmod.read.ahn.download_ahn4(extent)
Downloading tiles of AHN4:   0%|          | 0/1 [00:00<?, ?it/s]
Downloading tiles of AHN4: 100%|██████████| 1/1 [00:04<00:00,  4.17s/it]
Transform ahn data to structured grid
We create a dummy dataset with a structured grid, to which we will resample the AHN-data.
# create an empty model dataset
ds_ahn = nlmod.get_ds(extent, delr=100.0, layer=1)
INFO:nlmod.dims.base.to_model_ds:resample layer model data to structured modelgrid
norm = Normalize(ahn.min(), ahn.max())
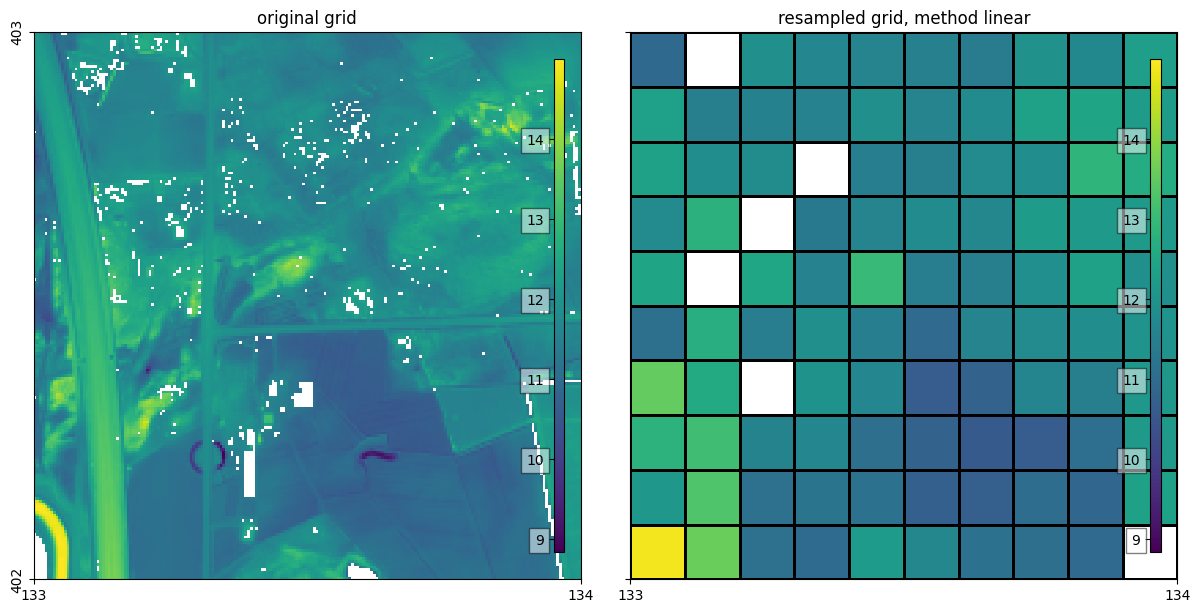
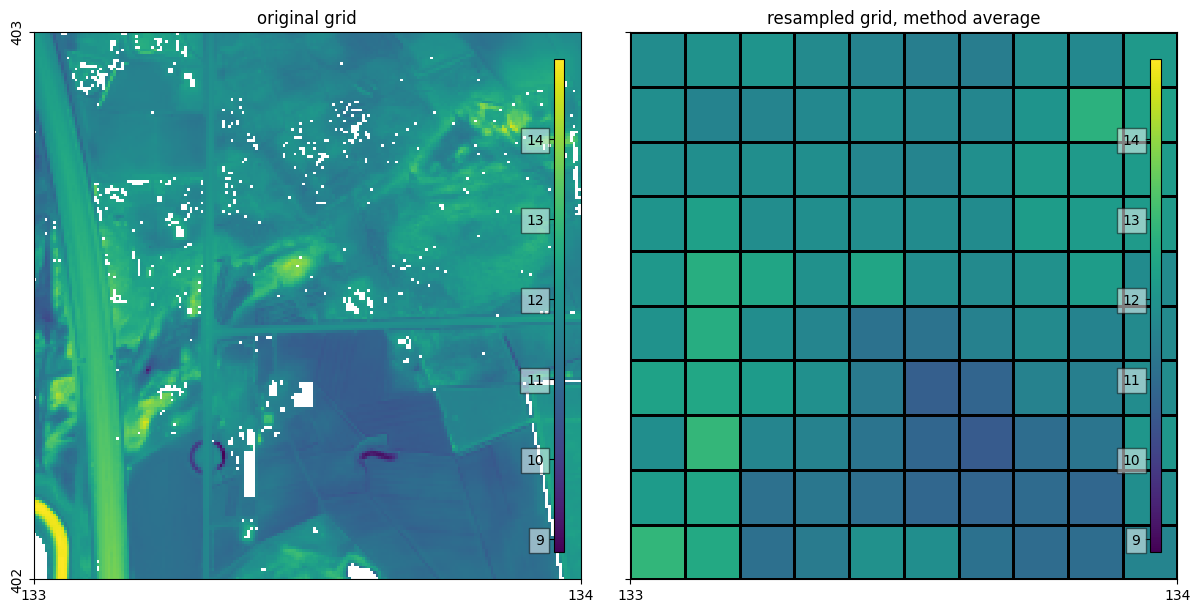
for method in ["nearest", "linear", "average", "min", "max"]:
ahn_res = nlmod.resample.structured_da_to_ds(ahn, ds_ahn, method=method)
fig, axes = nlmod.plot.get_map(extent, ncols=2, figsize=(12, 6))
pc = nlmod.plot.data_array(ahn, ax=axes[0], norm=norm)
nlmod.plot.colorbar_inside(pc, ax=axes[0])
axes[0].set_aspect("equal")
axes[0].set_title("original grid")
pc = nlmod.plot.data_array(ahn_res, ds_ahn, ax=axes[1], edgecolor="k", norm=norm)
nlmod.plot.colorbar_inside(pc, ax=axes[1])
axes[1].set_aspect("equal")
axes[1].set_title(f"resampled grid, method {method}")
Transform ahn data to vertex grid
We create a vertex grid by refining the cells along a line from the southwest to the northeast.
gdf = gpd.GeoDataFrame(
    geometry=[LineString([(extent[0], extent[2]), (extent[1], extent[3])]).buffer(10.0)]
)
dsv = nlmod.grid.refine(ds_ahn, model_ws="07_resampling", refinement_features=[(gdf, 1)])
INFO:nlmod.dims.grid.refine:create vertex grid using gridgen
INFO:nlmod.dims.grid.ds_to_gridprops:resample model Dataset to vertex modelgrid
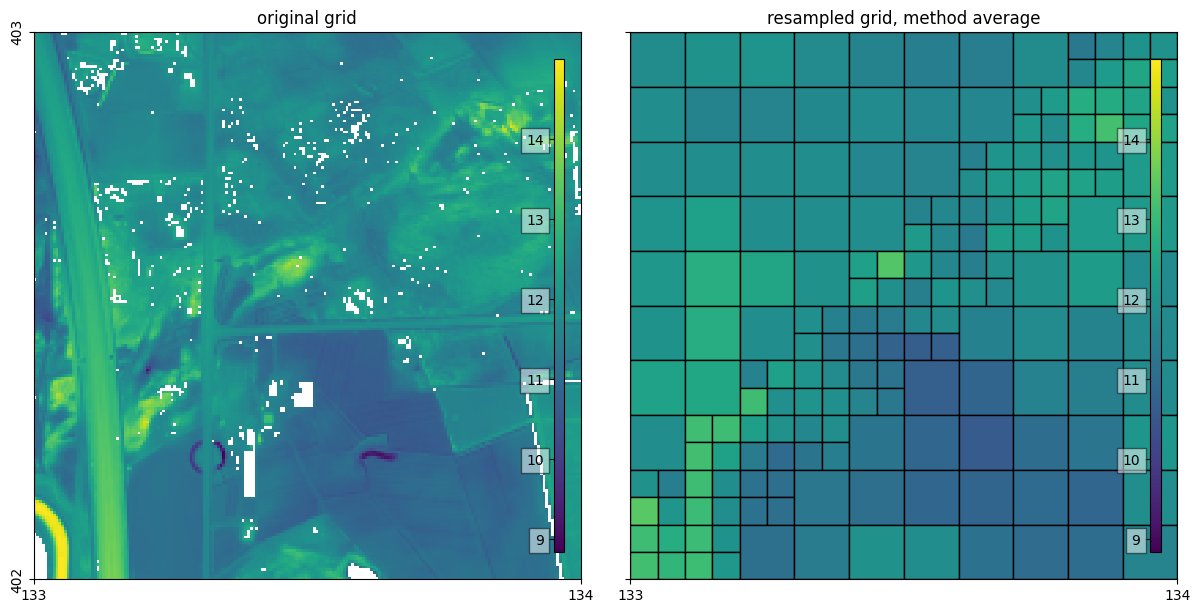
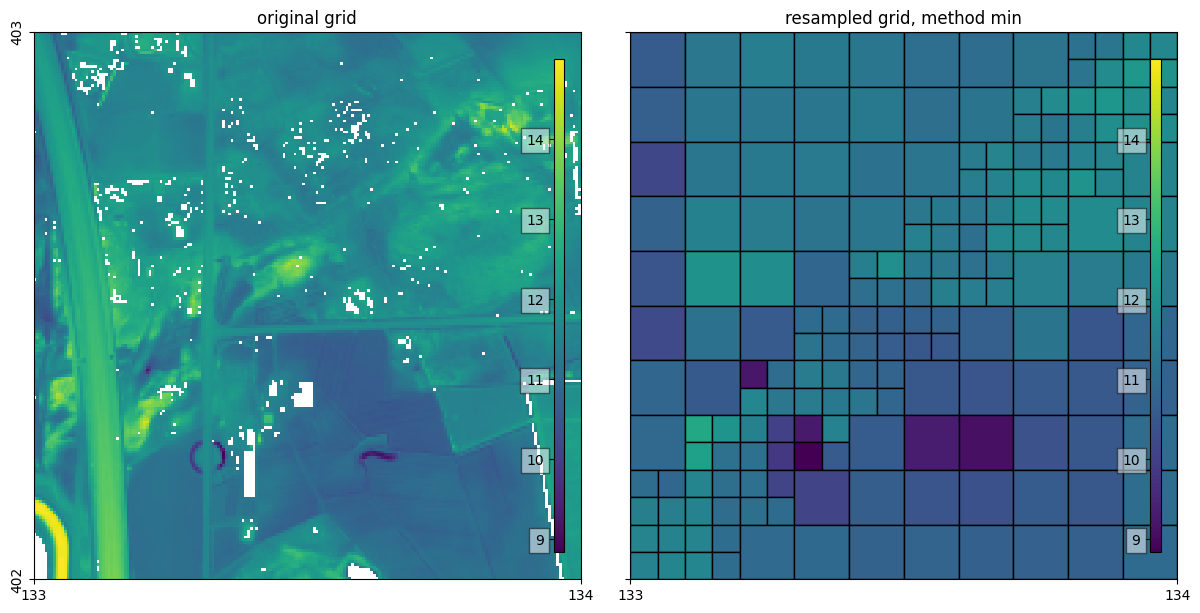
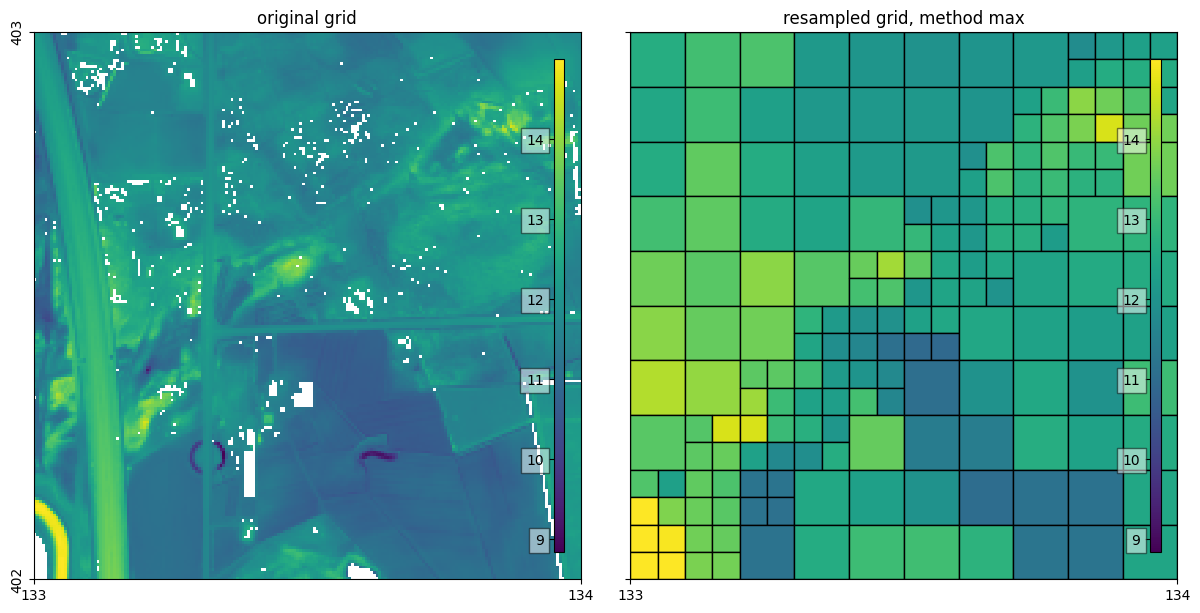
for method in ["nearest", "average", "min", "max"]:
    ahn_res = nlmod.resample.structured_da_to_ds(ahn, dsv, method=method)

    fig, axes = nlmod.plot.get_map(extent, ncols=2, figsize=(12, 6))
    pc = nlmod.plot.data_array(ahn, ax=axes[0], norm=norm)
    nlmod.plot.colorbar_inside(pc, ax=axes[0])
    axes[0].set_aspect("equal")
    axes[0].set_title("original grid")
    pc = nlmod.plot.data_array(ahn_res, dsv, ax=axes[1], edgecolor="k", norm=norm)
    nlmod.plot.colorbar_inside(pc, ax=axes[1])
    axes[1].set_aspect("equal")
    axes[1].set_title(f"resampled grid, method {method}")