Downloading meteorological data
In nlmod we can download meteorological data from the Dutch meteorlogical institute, using the Python package hydropandas in the background. In the following sections we will show different options for downloading and storing meteorological data:
Calculate recharge by subtracting evaporation from precipitation
Store precipitation and evaporation to seperate variables
Seperate the meteorological measurement values and the station locations
import matplotlib.pyplot as plt
import pandas as pd
import nlmod
nlmod.util.get_color_logger("INFO")
nlmod.show_versions()
Python version     : 3.11.14
NumPy version      : 2.4.4
Xarray version     : 2026.4.0
Matplotlib version : 3.10.9
Flopy version      : 3.10.0

nlmod version      : 0.11.3dev
Generate a model Datset
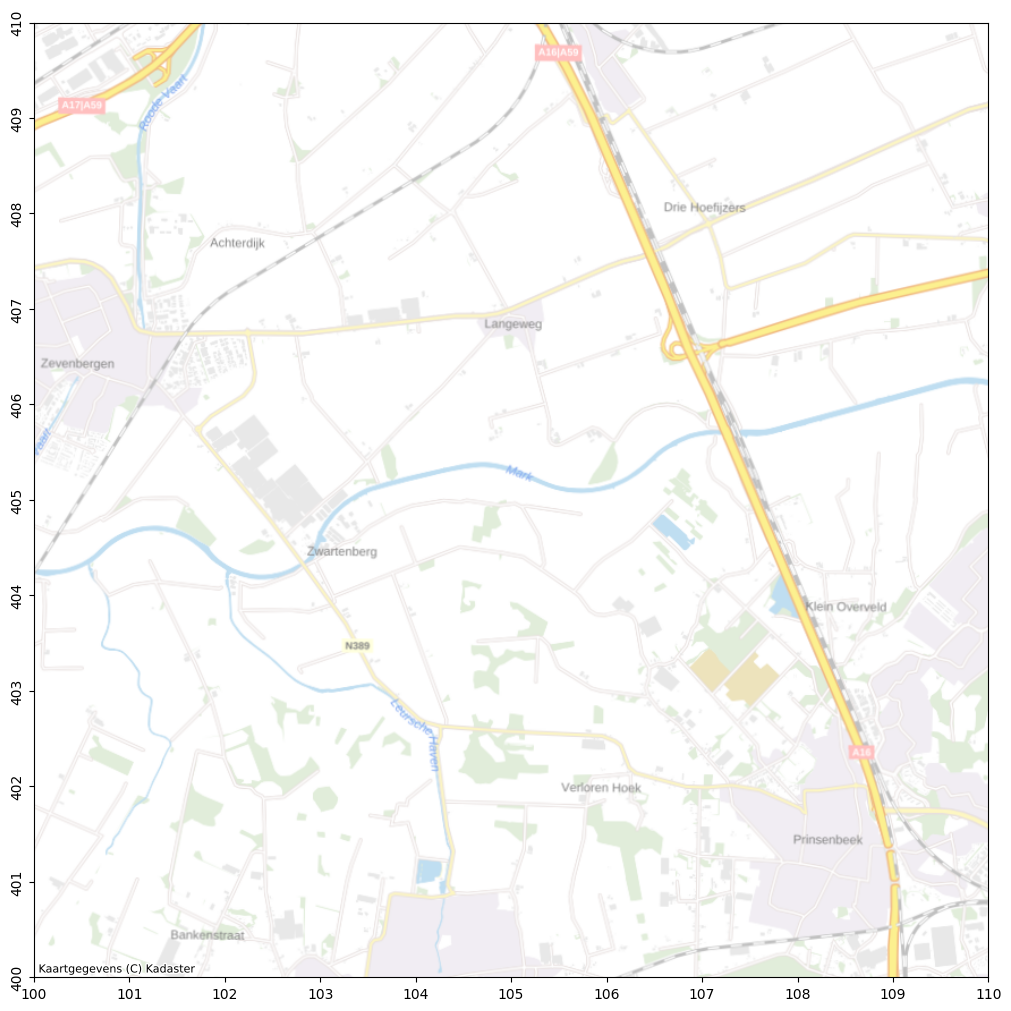
First we create a model Dataset for a specific part of the Netherlands.
extent = [100_000, 110_000, 400_000, 410_000]
ds = nlmod.get_ds(extent)
nlmod.plot.get_map(extent, background=True);
INFO:nlmod.dims.base.to_model_ds:resample layer model data to structured modelgrid
We need to set the time dimension of the model dataset, so we know what period we need to download meteorological data for.
We set our simulation time to be every day of the year 2024, and we set the start of our siumlation at the start of 2023. In this way we start with a steady state stress period with average meteorological data from the year 2023.
time = pd.date_range("2024-01-01", "2025-1-1", freq="D")
start = "2023-01-01"
ds = nlmod.time.set_ds_time(ds, start=start, time=time)
# show the contents of our time dimension
ds.time
<xarray.DataArray 'time' (time: 367)> Size: 3kB
array(['2024-01-01T00:00:00.000000000', '2024-01-02T00:00:00.000000000',
       '2024-01-03T00:00:00.000000000', ..., '2024-12-30T00:00:00.000000000',
       '2024-12-31T00:00:00.000000000', '2025-01-01T00:00:00.000000000'],
      shape=(367,), dtype='datetime64[ns]')
Coordinates:
  * time         (time) datetime64[ns] 3kB 2024-01-01 2024-01-02 ... 2025-01-01
    spatial_ref  int64 8B 0
Attributes:
    name:         Time
    description:  End time of the stress period
    time_units:   DAYS
start: 2023-01-01 00:00:00Calculate recharge by subtracting evaporation from precipitation
We use the method nlmod.read.knmi.get_recharge to download recharge data from the KNMI for our entire model area. This method downloads precipitation-data (“RD”) from precipitation-stations (“neerslagstations”) and Makking-evaporation data (“EV24”) from the meteoroogical stations (weerstations) of the KNMI. As can be seen from the info-messages below, we see that data from several precipitation-stations is downloaded, and date from one meteoroogical station.
By default, nlmod.read.knmi.get_recharge subtracts the evaporation form the precipitation, to calculate the groundwater recharge. This recharge is returned as the variable recharge in the returned xarray Dataset.
meteo = nlmod.read.knmi.get_recharge(ds)
# show the contents of the returned dataset
meteo
INFO:hydropandas.io.knmi.get_knmi_obs:get data from station 813 and variable RD from 2023-01-01 to 2025-01-01
INFO:hydropandas.io.knmi.fill_missing_measurements:station 813 has no measurements between 2023-01-01 00:00:00 and 2025-01-01 00:00:00 trying to get measurements from nearest station -> 455
INFO:hydropandas.io.knmi.get_knmi_obs:get data from station 826 and variable RD from 2023-01-01 to 2025-01-01
INFO:hydropandas.io.knmi.fill_missing_measurements:station 826 has no measurements between 2023-01-01 00:00:00 and 2025-01-01 00:00:00 trying to get measurements from nearest station -> 455
INFO:hydropandas.io.knmi.get_knmi_obs:get data from station 841 and variable RD from 2023-01-01 to 2025-01-01
INFO:hydropandas.io.knmi.get_knmi_obs:get data from station 810 and variable RD from 2023-01-01 to 2025-01-01
INFO:hydropandas.io.knmi.fill_missing_measurements:station 810 has no measurements between 2023-01-01 00:00:00 and 2025-01-01 00:00:00 trying to get measurements from nearest station -> 838
INFO:hydropandas.io.knmi.get_knmi_obs:get data from station 828 and variable RD from 2023-01-01 to 2025-01-01
INFO:hydropandas.io.knmi.get_knmi_obs:get data from station 838 and variable RD from 2023-01-01 to 2025-01-01
INFO:hydropandas.io.knmi.get_knmi_obs:get data from station 350 and variable EV24 from 2023-01-01 to 2025-01-01
WARNING:nlmod.read.knmi.discretize_knmi:The default of hourly_precision=False will be changed to True in a future version of nlmod. Pass hourly_precision=False to retain current behavior or hourly_precision=True to adopt the future default and silence this warning.
<xarray.Dataset> Size: 29MB
Dimensions:      (x: 100, y: 100, time: 367)
Coordinates:
  * x            (x) float64 800B 1e+05 1.002e+05 ... 1.098e+05 1.1e+05
  * y            (y) float64 800B 4.1e+05 4.098e+05 ... 4.002e+05 4e+05
  * time         (time) datetime64[ns] 3kB 2024-01-01 2024-01-02 ... 2025-01-01
    spatial_ref  int64 8B 0
Data variables:
    recharge     (time, y, x) float64 29MB 0.001554 0.001554 ... -0.0001 -0.0001
Attributes: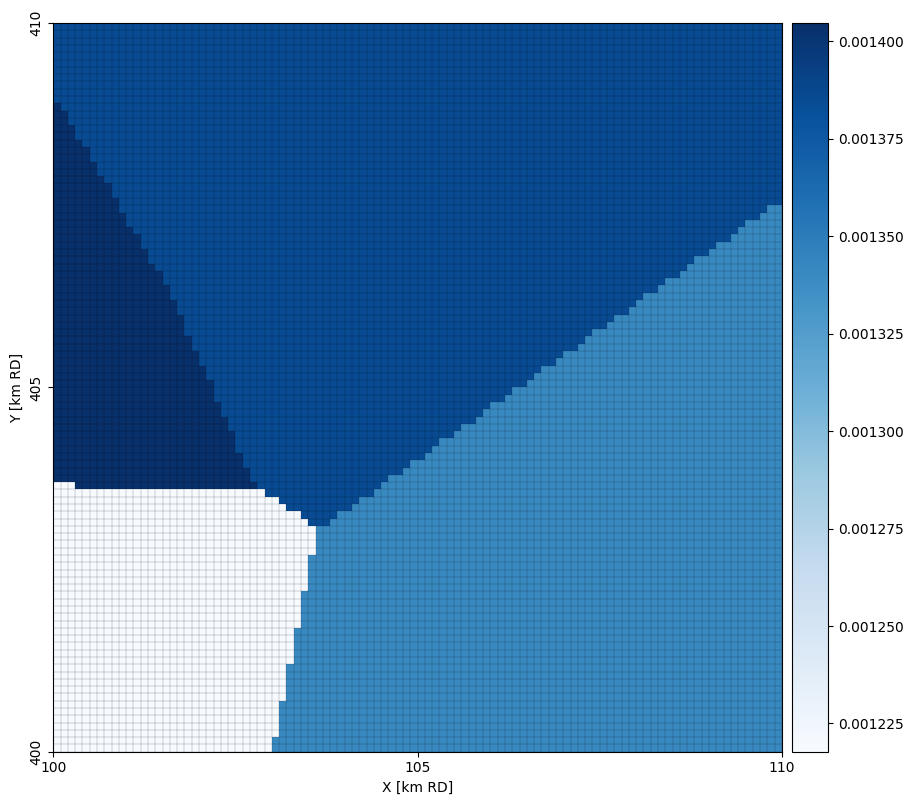
gridtype: structuredWe can plot the average rainfall over the entire time period. We see a Thiessen-polygon containing the precipitation-values.
nlmod.plot.map_array(meteo['recharge'][1:].mean(dim='time'), cmap='Blues', ds=ds);
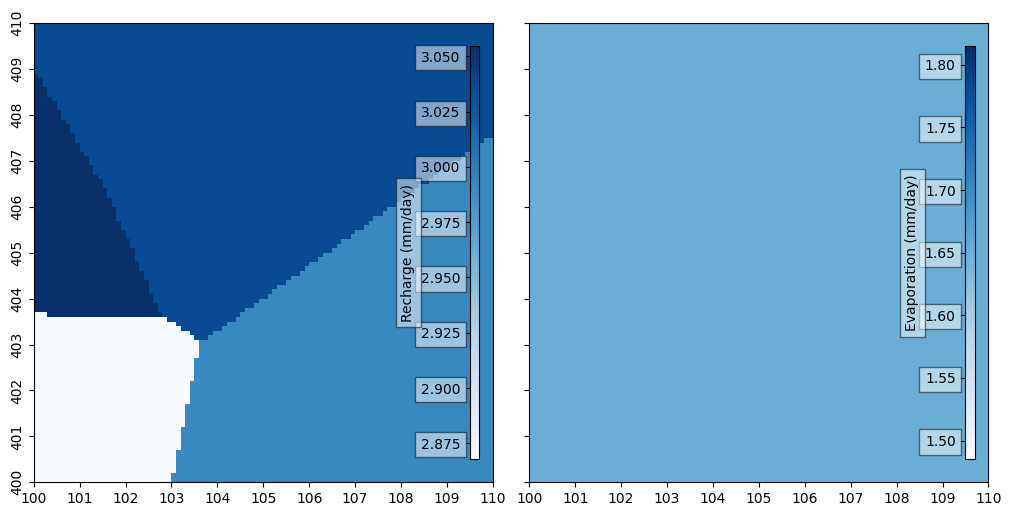
Store precipitation and evaporation to seperate variables
We can also return the precipitation and evaporation data in separate variables recharge and evaporation, to be used in the RCH-, EVT- and UZF-packages. We can use ds.update(meteo) to add these variables to the model dataset ds.
meteo = nlmod.read.knmi.get_recharge(ds, method="separate")
# show the contents of the returned dataset
meteo
INFO:hydropandas.io.knmi.get_knmi_obs:get data from station 813 and variable RD from 2023-01-01 to 2025-01-01
INFO:hydropandas.io.knmi.fill_missing_measurements:station 813 has no measurements between 2023-01-01 00:00:00 and 2025-01-01 00:00:00 trying to get measurements from nearest station -> 455
INFO:hydropandas.io.knmi.get_knmi_obs:get data from station 826 and variable RD from 2023-01-01 to 2025-01-01
INFO:hydropandas.io.knmi.fill_missing_measurements:station 826 has no measurements between 2023-01-01 00:00:00 and 2025-01-01 00:00:00 trying to get measurements from nearest station -> 455
INFO:hydropandas.io.knmi.get_knmi_obs:get data from station 841 and variable RD from 2023-01-01 to 2025-01-01
INFO:hydropandas.io.knmi.get_knmi_obs:get data from station 810 and variable RD from 2023-01-01 to 2025-01-01
INFO:hydropandas.io.knmi.fill_missing_measurements:station 810 has no measurements between 2023-01-01 00:00:00 and 2025-01-01 00:00:00 trying to get measurements from nearest station -> 838
INFO:hydropandas.io.knmi.get_knmi_obs:get data from station 828 and variable RD from 2023-01-01 to 2025-01-01
INFO:hydropandas.io.knmi.get_knmi_obs:get data from station 838 and variable RD from 2023-01-01 to 2025-01-01
INFO:hydropandas.io.knmi.get_knmi_obs:get data from station 350 and variable EV24 from 2023-01-01 to 2025-01-01
WARNING:nlmod.read.knmi.discretize_knmi:The default of hourly_precision=False will be changed to True in a future version of nlmod. Pass hourly_precision=False to retain current behavior or hourly_precision=True to adopt the future default and silence this warning.
<xarray.Dataset> Size: 59MB
Dimensions:      (x: 100, y: 100, time: 367)
Coordinates:
  * x            (x) float64 800B 1e+05 1.002e+05 ... 1.098e+05 1.1e+05
  * y            (y) float64 800B 4.1e+05 4.098e+05 ... 4.002e+05 4e+05
  * time         (time) datetime64[ns] 3kB 2024-01-01 2024-01-02 ... 2025-01-01
    spatial_ref  int64 8B 0
Data variables:
    recharge     (time, y, x) float64 29MB 0.003351 0.003351 ... 0.0 0.0
    evaporation  (time, y, x) float64 29MB 0.001798 0.001798 ... 0.0001 0.0001
Attributes:
gridtype: structuredf, ax = nlmod.plot.get_map(extent, ncols=2)
qm = nlmod.plot.data_array(meteo['recharge'][1:].mean(dim='time') * 1000, cmap='Blues', ds=ds, ax=ax[0])
nlmod.plot.colorbar_inside(qm, ax=ax[0], label='Recharge (mm/day)')
qm = nlmod.plot.data_array(meteo['evaporation'][1:].mean(dim='time') * 1000, cmap='Blues', ds=ds, ax=ax[1])
nlmod.plot.colorbar_inside(qm, ax=ax[1], label='Evaporation (mm/day)');
Seperate the meteorological measurement values and the station locations
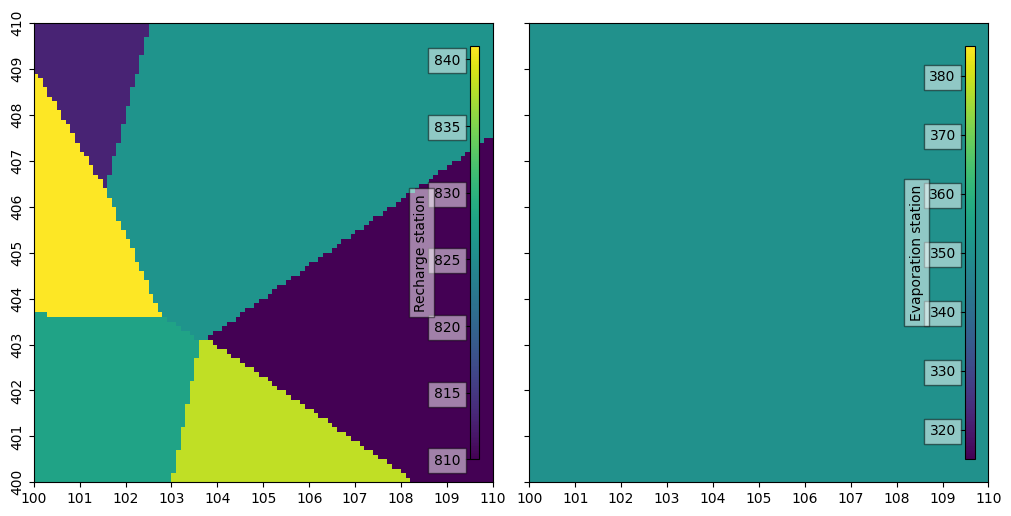
The previous data is transformed to xarray DataArrays with dimensions time, y and x, with many duplicate values for cells near to the same station. If we do not want this 3d-array with a lot of duplicate values, we can use the optional parameter add_stn_dimensions. If we set this parameter to True, the recharge and evaporation variables contain the dimensions stn_RD and stn_EV24, and the variables recharge_stn and evaporation_stn contain the station-number that is used in every model cell. This way of storing meteorlogiscal data in the model dataset is also supported in the generation of the RCH- EVT- and UZF-packages.
meteo = nlmod.read.knmi.get_recharge(ds, add_stn_dimensions=True)
# show the contents of the returned dataset
meteo
INFO:hydropandas.io.knmi.get_knmi_obs:get data from station 813 and variable RD from 2023-01-01 to 2025-01-01
INFO:hydropandas.io.knmi.fill_missing_measurements:station 813 has no measurements between 2023-01-01 00:00:00 and 2025-01-01 00:00:00 trying to get measurements from nearest station -> 455
INFO:hydropandas.io.knmi.get_knmi_obs:get data from station 826 and variable RD from 2023-01-01 to 2025-01-01
INFO:hydropandas.io.knmi.fill_missing_measurements:station 826 has no measurements between 2023-01-01 00:00:00 and 2025-01-01 00:00:00 trying to get measurements from nearest station -> 455
INFO:hydropandas.io.knmi.get_knmi_obs:get data from station 841 and variable RD from 2023-01-01 to 2025-01-01
INFO:hydropandas.io.knmi.get_knmi_obs:get data from station 810 and variable RD from 2023-01-01 to 2025-01-01
INFO:hydropandas.io.knmi.fill_missing_measurements:station 810 has no measurements between 2023-01-01 00:00:00 and 2025-01-01 00:00:00 trying to get measurements from nearest station -> 838
INFO:hydropandas.io.knmi.get_knmi_obs:get data from station 828 and variable RD from 2023-01-01 to 2025-01-01
INFO:hydropandas.io.knmi.get_knmi_obs:get data from station 838 and variable RD from 2023-01-01 to 2025-01-01
INFO:hydropandas.io.knmi.get_knmi_obs:get data from station 350 and variable EV24 from 2023-01-01 to 2025-01-01
WARNING:nlmod.read.knmi.discretize_knmi:The default of hourly_precision=False will be changed to True in a future version of nlmod. Pass hourly_precision=False to retain current behavior or hourly_precision=True to adopt the future default and silence this warning.
<xarray.Dataset> Size: 185kB
Dimensions:          (x: 100, y: 100, time: 367, stn_RD: 6, stn_EV24: 1)
Coordinates:
  * x                (x) float64 800B 1e+05 1.002e+05 ... 1.098e+05 1.1e+05
  * y                (y) float64 800B 4.1e+05 4.098e+05 ... 4.002e+05 4e+05
  * time             (time) datetime64[ns] 3kB 2024-01-01 ... 2025-01-01
  * stn_RD           (stn_RD) int64 48B 813 826 841 810 828 838
  * stn_EV24         (stn_EV24) int64 8B 350
    spatial_ref      int64 8B 0
Data variables:
    recharge_stn     (y, x) int64 80kB 813 813 813 813 813 ... 810 810 810 810
    recharge         (time, stn_RD) float64 18kB 0.003351 0.003351 ... 0.0 0.0
    evaporation_stn  (y, x) int64 80kB 350 350 350 350 350 ... 350 350 350 350
    evaporation      (time, stn_EV24) float64 3kB 0.001798 0.0003 ... 0.0001
Attributes:
gridtype: structuredf, ax = nlmod.plot.get_map(extent, ncols=2)
qm = nlmod.plot.data_array(meteo['recharge_stn'], ds=ds, ax=ax[0])
nlmod.plot.colorbar_inside(qm, ax=ax[0], label='Recharge station')
qm = nlmod.plot.data_array(meteo['evaporation_stn'], ds=ds, ax=ax[1])
nlmod.plot.colorbar_inside(qm, ax=ax[1], label='Evaporation station');
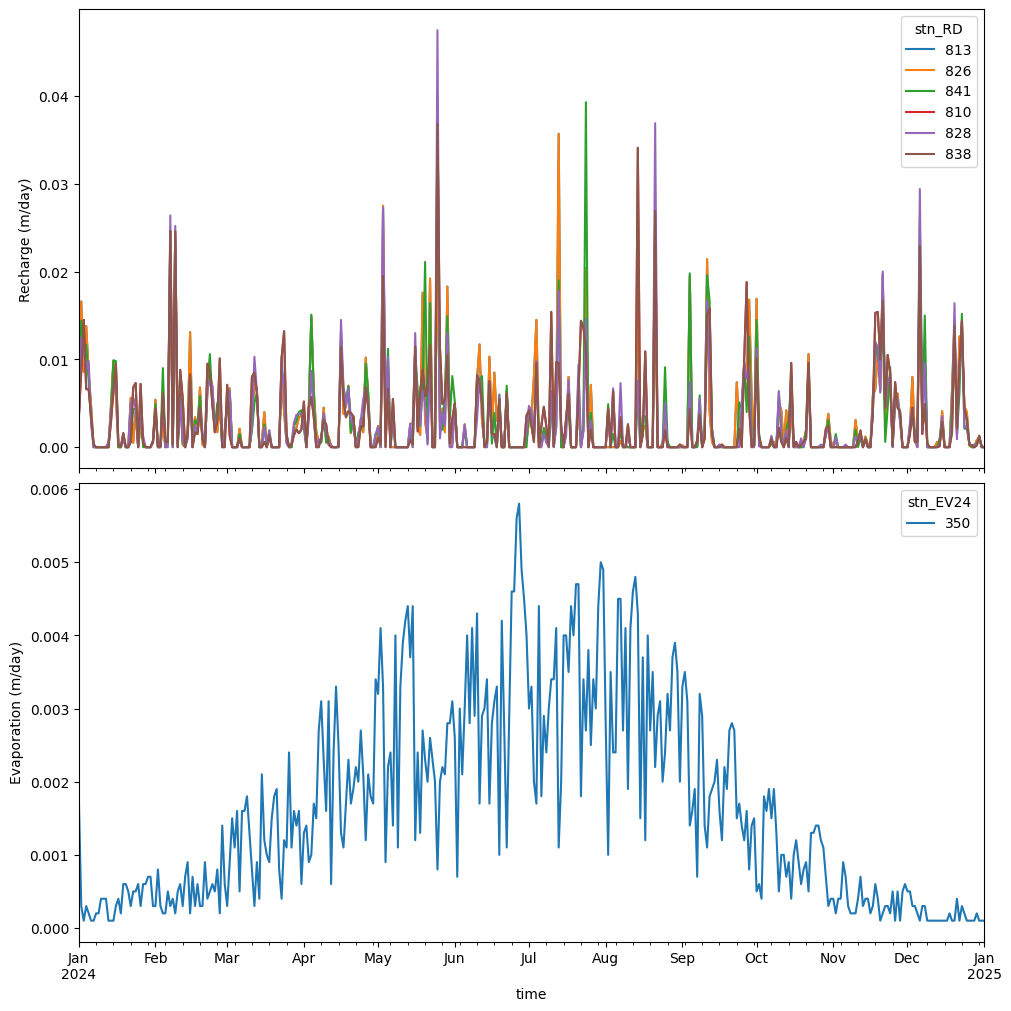
We can now better plot the measurement-values from the indiviudeal measurement-stations.
f, axes = plt.subplots(figsize=(10, 10), nrows=2, sharex=True, layout="constrained")

meteo['recharge'].to_pandas().plot(ax=axes[0])
axes[0].set_ylabel('Recharge (m/day)')
meteo['evaporation'].to_pandas().plot(ax=axes[1])
axes[1].set_ylabel('Evaporation (m/day)');