Gridding vector data
Vector data can be points, lines or polygons often saved as shapefiles and visualised using GIS software. A common operation is to project vector data on a modelgrid. For example, to add a surface water line to a grid. In this section we present some functions in nlmod to project vector data on a modelgrid and to aggregate vector data to model cells.
import geopandas as gpd
import matplotlib.pyplot as plt
import numpy as np
import xarray as xr
from IPython.display import display
from shapely.geometry import LineString, Point
from shapely.geometry import Polygon as shp_polygon

import nlmod
nlmod.show_versions()
Python version     : 3.11.14
NumPy version      : 2.4.4
Xarray version     : 2026.4.0
Matplotlib version : 3.10.9
Flopy version      : 3.10.0

nlmod version      : 0.11.3dev
Grid types
We create the same two grids as in the ‘Resampling raster data’ notebook.
# structured grid
ds = nlmod.get_ds([950, 1250, 20050, 20350], delr=100)
# vertex grid
dsv = nlmod.grid.refine(
    ds, refinement_features=[([Point(1200, 20200)], "point", 1)], model_ws="06_gridding_vector_data"
)
Vector to grid
point_geom = [
    Point(x, y) for x, y in zip([1000, 1200, 1225, 1300], [20200, 20175, 20175, 20425])
]
point_gdf = gpd.GeoDataFrame({"values": [1, 52, 66, 24]}, geometry=point_geom)
line_geom = [
    LineString([point_geom[0], point_geom[1]]),
    LineString([point_geom[2], point_geom[3]]),
    LineString([point_geom[0], point_geom[3]]),
]
line_gdf = gpd.GeoDataFrame({"values": [1, 52, 66]}, geometry=line_geom)
pol_geom = [
    shp_polygon(
        [
            [p.x, p.y]
            for p in [point_geom[0], point_geom[1], point_geom[2], point_geom[3]]
        ]
    ),
    shp_polygon(
        [
            [p.x, p.y]
            for p in [point_geom[0], point_geom[1], point_geom[2], Point(1200, 20300)]
        ]
    ),
]
pol_gdf = gpd.GeoDataFrame({"values": [166, 5]}, geometry=pol_geom)
fig, ax = plt.subplots()
nlmod.grid.modelgrid_from_ds(ds).plot(ax=ax)
point_gdf.plot(ax=ax, color="green")
line_gdf.plot(ax=ax, color="purple")
pol_gdf.plot(ax=ax, alpha=0.6)

ax.set_xlim(ax.get_xlim()[0], 1400)
ax.set_ylim(ax.get_ylim()[0], 20500)
(20050.0, 20500.0)

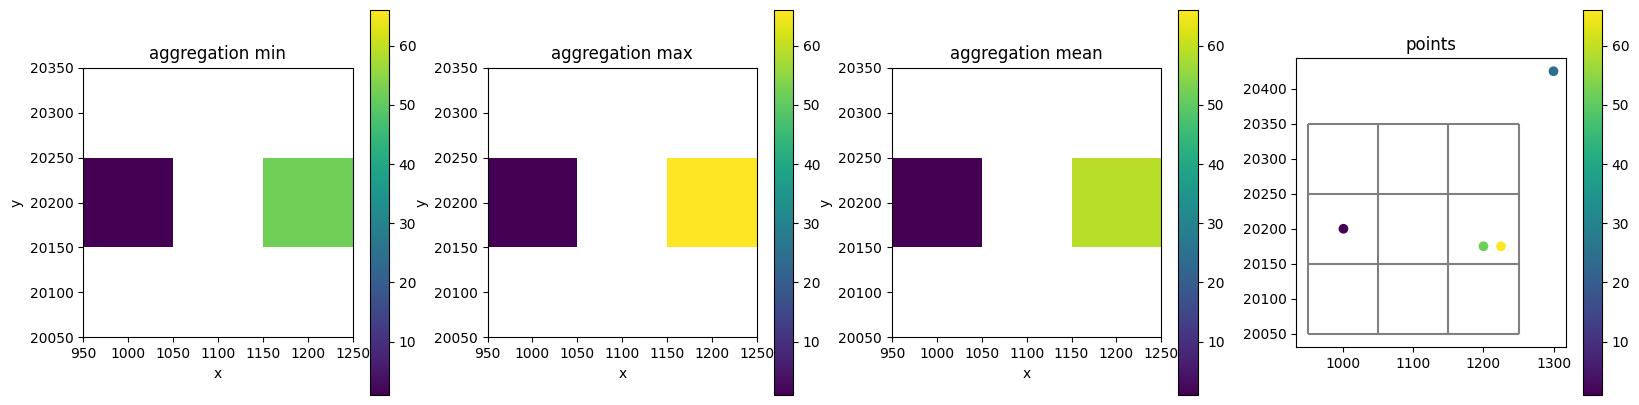
Points
Aggregation methods
fig, axes = plt.subplots(ncols=4, figsize=(20, 5))

da1 = nlmod.grid.gdf_to_da(point_gdf, ds, "values", agg_method="min")
da2 = nlmod.grid.gdf_to_da(point_gdf, ds, "values", agg_method="max")
da3 = nlmod.grid.gdf_to_da(point_gdf, ds, "values", agg_method="mean")

vmin = min(da1.min(), da2.min(), da3.min())
vmax = max(da1.max(), da2.max(), da3.max())

da1.plot(ax=axes[0], vmin=vmin, vmax=vmax)
axes[0].set_title("aggregation min")
axes[0].axis("scaled")

da2.plot(ax=axes[1], vmin=vmin, vmax=vmax)
axes[1].set_title("aggregation max")
axes[1].axis("scaled")

da3.plot(ax=axes[2], vmin=vmin, vmax=vmax)
axes[2].set_title("aggregation mean")
axes[2].axis("scaled")

point_gdf.plot("values", ax=axes[3], vmin=vmin, vmax=vmax, legend=True)
nlmod.grid.modelgrid_from_ds(ds).plot(ax=axes[3])
axes[3].set_title("points")
axes[3].axis("scaled")
Intersecting with grid:   0%|          | 0/4 [00:00<?, ?it/s]
Intersecting with grid: 100%|██████████| 4/4 [00:00<00:00, 372.83it/s]
Intersecting with grid:   0%|          | 0/4 [00:00<?, ?it/s]
Intersecting with grid: 100%|██████████| 4/4 [00:00<00:00, 418.71it/s]
Intersecting with grid:   0%|          | 0/4 [00:00<?, ?it/s]
Intersecting with grid: 100%|██████████| 4/4 [00:00<00:00, 422.96it/s]
(np.float64(932.5),
 np.float64(1317.5),
 np.float64(20031.25),
 np.float64(20443.75))
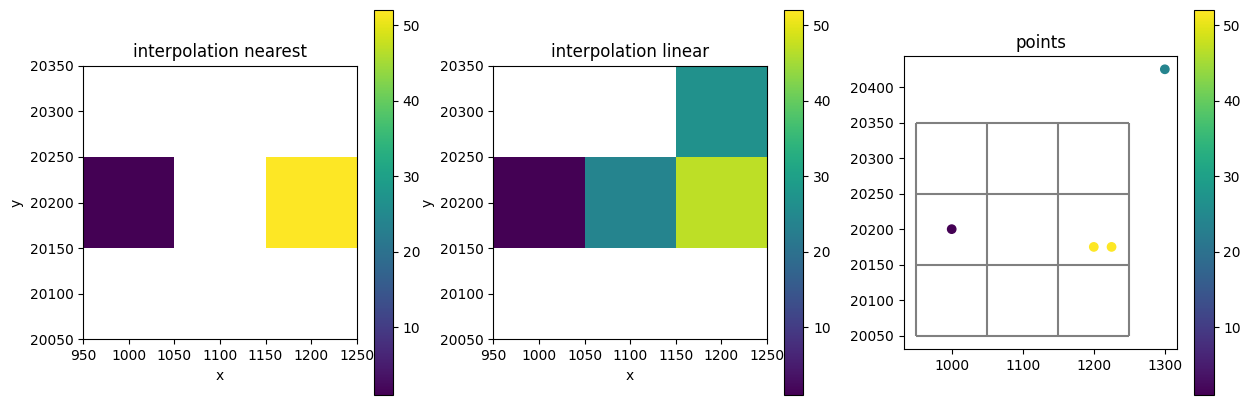
Interpolation methods
fig, axes = plt.subplots(ncols=3, figsize=(15, 5))
ds.attrs["model_ws"] = ""
sim = nlmod.sim.sim(ds)
gwf = nlmod.gwf.gwf(ds, sim)
dis = nlmod.gwf.dis(ds, gwf)
da1 = nlmod.grid.gdf_to_da(point_gdf, ds, column="values", agg_method="nearest")
da2 = xr.DataArray(np.nan, dims=("y", "x"), coords={"y": ds.y, "x": ds.x})
da2.values = nlmod.grid.interpolate_gdf_to_array(
    point_gdf, gwf, field="values", method="linear"
)

vmin = min(da1.min(), da2.min())
vmax = max(da1.max(), da2.max())

da1.plot(ax=axes[0], vmin=vmin, vmax=vmax)
axes[0].set_title("interpolation nearest")
axes[0].axis("scaled")

da2.plot(ax=axes[1], vmin=vmin, vmax=vmax)
axes[1].set_title("interpolation linear")
axes[1].axis("scaled")


point_gdf.plot("values", ax=axes[2], vmin=vmin, vmax=vmax, legend=True)
nlmod.grid.modelgrid_from_ds(ds).plot(ax=axes[2])
axes[2].set_title("points")
axes[2].axis("scaled")
Intersecting with grid:   0%|          | 0/4 [00:00<?, ?it/s]
Intersecting with grid: 100%|██████████| 4/4 [00:00<00:00, 405.11it/s]
Aggregate vector data:   0%|          | 0/2 [00:00<?, ?it/s]
Aggregate vector data: 100%|██████████| 2/2 [00:00<00:00, 1251.10it/s]
(np.float64(932.5),
 np.float64(1317.5),
 np.float64(20031.25),
 np.float64(20443.75))
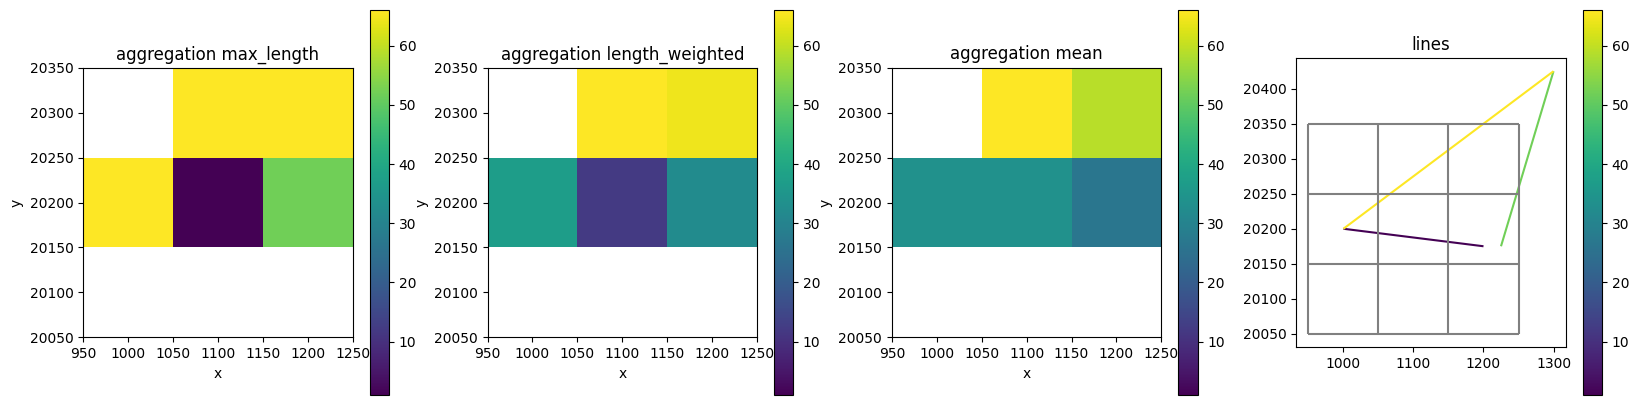
Lines
fig, axes = plt.subplots(ncols=4, figsize=(20, 5))

da1 = nlmod.grid.gdf_to_da(line_gdf, ds, "values", agg_method="max_length")
da2 = nlmod.grid.gdf_to_da(line_gdf, ds, "values", agg_method="length_weighted")
da3 = nlmod.grid.gdf_to_da(line_gdf, ds, "values", agg_method="mean")

vmin = min(da1.min(), da2.min(), da3.min())
vmax = max(da1.max(), da2.max(), da3.max())

da1.plot(ax=axes[0], vmin=vmin, vmax=vmax)
axes[0].set_title("aggregation max_length")
axes[0].axis("scaled")

da2.plot(ax=axes[1], vmin=vmin, vmax=vmax)
axes[1].set_title("aggregation length_weighted")
axes[1].axis("scaled")

da3.plot(ax=axes[2], vmin=vmin, vmax=vmax)
axes[2].set_title("aggregation mean")
axes[2].axis("scaled")

line_gdf.plot("values", ax=axes[3], vmin=vmin, vmax=vmax, legend=True)
nlmod.grid.modelgrid_from_ds(ds).plot(ax=axes[3])
axes[3].set_title("lines")
axes[3].axis("scaled")
Intersecting with grid:   0%|          | 0/3 [00:00<?, ?it/s]
Intersecting with grid: 100%|██████████| 3/3 [00:00<00:00, 286.41it/s]
Aggregate vector data:   0%|          | 0/5 [00:00<?, ?it/s]
Aggregate vector data: 100%|██████████| 5/5 [00:00<00:00, 2069.22it/s]
Intersecting with grid:   0%|          | 0/3 [00:00<?, ?it/s]
Intersecting with grid: 100%|██████████| 3/3 [00:00<00:00, 325.72it/s]
Aggregate vector data:   0%|          | 0/5 [00:00<?, ?it/s]
Aggregate vector data: 100%|██████████| 5/5 [00:00<00:00, 1595.64it/s]
Intersecting with grid:   0%|          | 0/3 [00:00<?, ?it/s]
Intersecting with grid: 100%|██████████| 3/3 [00:00<00:00, 330.30it/s]
(np.float64(932.5),
 np.float64(1317.5),
 np.float64(20031.25),
 np.float64(20443.75))
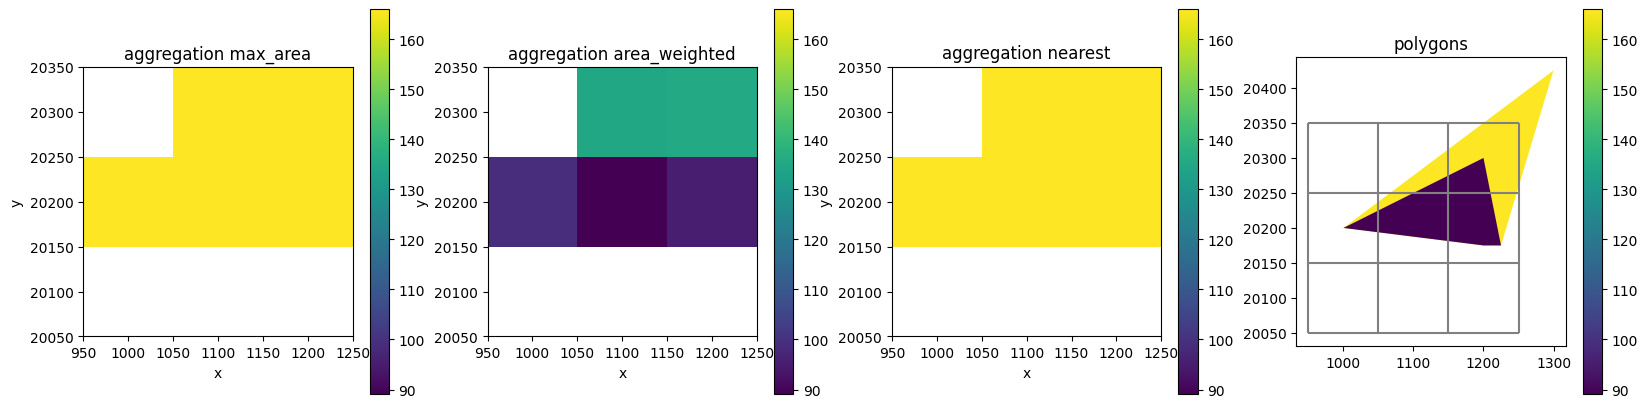
Polygons
fig, axes = plt.subplots(ncols=4, figsize=(20, 5))

da1 = nlmod.grid.gdf_to_da(pol_gdf, ds, "values", agg_method="max_area")
da2 = nlmod.grid.gdf_to_da(pol_gdf, ds, "values", agg_method="area_weighted")
da3 = nlmod.grid.gdf_to_da(pol_gdf, ds, "values", agg_method="nearest")

vmin = min(da1.min(), da2.min(), da3.min())
vmax = max(da1.max(), da2.max(), da3.max())

da1.plot(ax=axes[0], vmin=vmin, vmax=vmax)
axes[0].set_title("aggregation max_area")
axes[0].axis("scaled")

da2.plot(ax=axes[1], vmin=vmin, vmax=vmax)
axes[1].set_title("aggregation area_weighted")
axes[1].axis("scaled")

da3.plot(ax=axes[2], vmin=vmin, vmax=vmax)
axes[2].set_title("aggregation nearest")
axes[2].axis("scaled")

pol_gdf.plot("values", ax=axes[3], vmin=vmin, vmax=vmax, legend=True)
nlmod.grid.modelgrid_from_ds(ds).plot(ax=axes[3])
axes[3].set_title("polygons")
axes[3].axis("scaled")
Intersecting with grid:   0%|          | 0/2 [00:00<?, ?it/s]
Intersecting with grid: 100%|██████████| 2/2 [00:00<00:00, 196.66it/s]
Aggregate vector data:   0%|          | 0/5 [00:00<?, ?it/s]
Aggregate vector data: 100%|██████████| 5/5 [00:00<00:00, 2145.64it/s]
Intersecting with grid:   0%|          | 0/2 [00:00<?, ?it/s]
Intersecting with grid: 100%|██████████| 2/2 [00:00<00:00, 219.70it/s]
Intersecting with grid:   0%|          | 0/2 [00:00<?, ?it/s]
Intersecting with grid: 100%|██████████| 2/2 [00:00<00:00, 223.00it/s]
Aggregate vector data:   0%|          | 0/5 [00:00<?, ?it/s]
Aggregate vector data: 100%|██████████| 5/5 [00:00<00:00, 1968.97it/s]
(np.float64(932.5),
 np.float64(1317.5),
 np.float64(20031.25),
 np.float64(20443.75))
Intersect vector data with grid
gdf_point_grid = nlmod.grid.gdf_to_grid(point_gdf, ds)
gdf_line_grid = nlmod.grid.gdf_to_grid(line_gdf, ds)
gdf_pol_grid = nlmod.grid.gdf_to_grid(pol_gdf, ds)
Intersecting with grid:   0%|          | 0/4 [00:00<?, ?it/s]
Intersecting with grid: 100%|██████████| 4/4 [00:00<00:00, 382.83it/s]
Intersecting with grid:   0%|          | 0/3 [00:00<?, ?it/s]
Intersecting with grid: 100%|██████████| 3/3 [00:00<00:00, 327.26it/s]
Intersecting with grid:   0%|          | 0/2 [00:00<?, ?it/s]
Intersecting with grid: 100%|██████████| 2/2 [00:00<00:00, 218.72it/s]
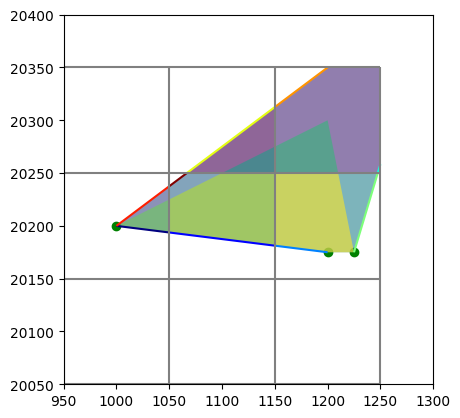
fig, ax = plt.subplots()

gdf_point_grid.plot(ax=ax, color="green")
gdf_line_grid["ind"] = range(gdf_line_grid.shape[0])
gdf_line_grid.plot("ind", ax=ax, cmap="jet")
gdf_pol_grid["ind"] = range(gdf_pol_grid.shape[0])
gdf_pol_grid.plot("ind", ax=ax, alpha=0.6)

nlmod.grid.modelgrid_from_ds(ds).plot(ax=ax)
ax.set_xlim(ax.get_xlim()[0], 1300)
ax.set_ylim(ax.get_ylim()[0], 20400)
(20050.0, 20400.0)
Aggregate parameters per model cell
Aggregation options:
point: max, min, mean
line: max, min, length_weighted, max_length
polygon: max, min, area_weighted, area_max
# point
display(gdf_point_grid)
nlmod.grid.aggregate_vector_per_cell(gdf_point_grid, {"values": "max"})
| values | geometry | cellid | |
|---|---|---|---|
| 0 | 1 | POINT (1000 20200) | (1, 0) |
| 1 | 52 | POINT (1200 20175) | (1, 2) |
| 2 | 66 | POINT (1225 20175) | (1, 2) |
| values | ||
|---|---|---|
| 1 | 0 | 1 |
| 2 | 66 |
# line
display(gdf_line_grid)
nlmod.grid.aggregate_vector_per_cell(gdf_line_grid, {"values": "length_weighted"})
| values | geometry | cellid | ind | |
|---|---|---|---|---|
| 0 | 1 | LINESTRING (1000 20200, 1050 20193.75) | (1, 0) | 0 |
| 0 | 1 | LINESTRING (1050 20193.75, 1150 20181.25) | (1, 1) | 1 |
| 0 | 1 | LINESTRING (1150 20181.25, 1200 20175) | (1, 2) | 2 |
| 1 | 52 | LINESTRING (1247.5 20250, 1250 20258.333) | (0, 2) | 3 |
| 1 | 52 | LINESTRING (1225 20175, 1247.5 20250) | (1, 2) | 4 |
| 2 | 66 | LINESTRING (1066.667 20250, 1150 20312.5) | (0, 1) | 5 |
| 2 | 66 | LINESTRING (1150 20312.5, 1200 20350) | (0, 2) | 6 |
| 2 | 66 | LINESTRING (1000 20200, 1050 20237.5) | (1, 0) | 7 |
| 2 | 66 | LINESTRING (1050 20237.5, 1066.667 20250) | (1, 1) | 8 |
Aggregate vector data:   0%|          | 0/5 [00:00<?, ?it/s]
Aggregate vector data: 100%|██████████| 5/5 [00:00<00:00, 1497.00it/s]
| values | ||
|---|---|---|
| 0 | 1 | 66.000000 |
| 2 | 64.289282 | |
| 1 | 0 | 36.986642 |
| 1 | 12.135181 | |
| 2 | 32.030954 |
# polygon
display(gdf_pol_grid)
nlmod.grid.aggregate_vector_per_cell(gdf_pol_grid, {"values": "area_weighted"})
| values | geometry | cellid | area | ind | |
|---|---|---|---|---|---|
| 0 | 166 | POLYGON ((1150 20312.5, 1150 20250, 1066.667 2... | (0, 1) | 2604.166667 | 0 |
| 0 | 166 | POLYGON ((1247.5 20250, 1150 20250, 1150 20312... | (0, 2) | 9052.083333 | 1 |
| 0 | 166 | POLYGON ((1000 20200, 1050 20237.5, 1050 20193... | (1, 0) | 1093.750000 | 2 |
| 0 | 166 | POLYGON ((1050 20193.75, 1050 20237.5, 1066.66... | (1, 1) | 6145.833333 | 3 |
| 0 | 166 | POLYGON ((1225 20175, 1200 20175, 1150 20181.2... | (1, 2) | 6312.500000 | 4 |
| 1 | 5 | POLYGON ((1150 20275, 1150 20250, 1100 20250, ... | (0, 1) | 625.000000 | 5 |
| 1 | 5 | POLYGON ((1200 20300, 1210 20250, 1150 20250, ... | (0, 2) | 2125.000000 | 6 |
| 1 | 5 | POLYGON ((1000 20200, 1050 20225, 1050 20193.7... | (1, 0) | 781.250000 | 7 |
| 1 | 5 | POLYGON ((1050 20193.75, 1050 20225, 1100 2025... | (1, 1) | 5625.000000 | 8 |
| 1 | 5 | POLYGON ((1225 20175, 1200 20175, 1150 20181.2... | (1, 2) | 4906.250000 | 9 |
| values | ||
|---|---|---|
| 0 | 1 | 134.838710 |
| 2 | 135.390494 | |
| 1 | 0 | 98.916667 |
| 1 | 89.061947 | |
| 2 | 95.590529 |
Grid to reclist
For some modflow packages (drn, riv, ghb, wel) you need to specify stress_period_data to create them using flopy. This stress_period_data consists of lists of records, known as reclists (also called lrcd (“layer, row, column-data”) for a structured grid), for every time step.
The function da_to_reclist can be used to convert grid data (both structured and vertex) to a reclist. This function has many arguments:
mask, boolean DataArray to determine which cells should be added to the reclist. Can be 2d or 3d.layer, ifmaskis a 2d array the value oflayeris used in the reclist. Ifmaskis 3d orfirst_active_layeris True thelayerargument is ignored.only_active_cells, if True only add cells with an idomain of 1 to the reclistfirst_active_layer, if True use the first active layer, obtained from the idomain, as the layer for each cell.col1,col2andcol3, The column data of the reclist.
The examples below show the result of each argument.
# add layer dimension
if "layer" not in ds.dims:
    ds = ds.expand_dims({"layer": range(3)})

# create some data arrays
rng = np.random.default_rng(12345)
ds["da1"] = (
    ("layer", "y", "x"),
    rng.integers(0, 10, (ds.sizes["layer"], ds.sizes["y"], ds.sizes["x"])),
)
ds["da2"] = ("y", "x"), rng.integers(0, 10, (ds.sizes["y"], ds.sizes["x"]))
ds["da3"] = ("y", "x"), rng.integers(0, 10, (ds.sizes["y"], ds.sizes["x"]))

# add a nodata value
ds.attrs["nodata"] = -999

# set the thickness of the first cell to 0, so this cell will become inactive
ds["top"][0, 0] = ds["botm"][0, 0, 0]
Mask and layer
If mask is a 2d array, the layer argument specifies the layer that is used in the reclist.
# structured 2d grid to reclist
mask2d = ds["da2"] == ds["da2"][0, 0]
reclist1 = nlmod.grid.da_to_reclist(
    ds, mask2d, col1=ds["da1"][0], col2="da2", layer=0, only_active_cells=False
)
reclist1
[((0, np.int64(0), np.int64(0)), np.int64(6), np.int64(2)),
 ((0, np.int64(1), np.int64(0)), np.int64(3), np.int64(2))]
If the mask is three dimensional the layer argument is ignored.
# create a 3dmask
mask3d = ds["da1"] == ds["da1"].values[0, 0, 0]

# use this mask to create the reclist
reclist2 = nlmod.grid.da_to_reclist(
    ds, mask3d, col1="da1", col2=100, layer=0, only_active_cells=False
)
reclist2
[((np.int64(0), np.int64(0), np.int64(0)), np.int64(6), 100),
 ((np.int64(0), np.int64(2), np.int64(0)), np.int64(6), 100),
 ((np.int64(0), np.int64(2), np.int64(1)), np.int64(6), 100),
 ((np.int64(1), np.int64(2), np.int64(2)), np.int64(6), 100),
 ((np.int64(2), np.int64(0), np.int64(0)), np.int64(6), 100),
 ((np.int64(2), np.int64(2), np.int64(1)), np.int64(6), 100),
 ((np.int64(3), np.int64(2), np.int64(0)), np.int64(6), 100),
 ((np.int64(6), np.int64(2), np.int64(2)), np.int64(6), 100),
 ((np.int64(7), np.int64(0), np.int64(0)), np.int64(6), 100),
 ((np.int64(7), np.int64(1), np.int64(0)), np.int64(6), 100),
 ((np.int64(8), np.int64(2), np.int64(2)), np.int64(6), 100),
 ((np.int64(9), np.int64(0), np.int64(2)), np.int64(6), 100),
 ((np.int64(9), np.int64(1), np.int64(2)), np.int64(6), 100)]
Only active cells
With only_active_cells=True we make sure only active cells end up in the reclist. Which cells are active is based on the idomain in the model dataset.
# Only return the cells with an active idomain
reclist3 = nlmod.grid.da_to_reclist(
    ds, mask3d, col1="da1", col2=100, only_active_cells=True
)
reclist3
[((np.int64(0), np.int64(2), np.int64(0)), np.int64(6), 100),
 ((np.int64(0), np.int64(2), np.int64(1)), np.int64(6), 100),
 ((np.int64(1), np.int64(2), np.int64(2)), np.int64(6), 100),
 ((np.int64(2), np.int64(0), np.int64(0)), np.int64(6), 100),
 ((np.int64(2), np.int64(2), np.int64(1)), np.int64(6), 100),
 ((np.int64(3), np.int64(2), np.int64(0)), np.int64(6), 100),
 ((np.int64(6), np.int64(2), np.int64(2)), np.int64(6), 100),
 ((np.int64(7), np.int64(0), np.int64(0)), np.int64(6), 100),
 ((np.int64(7), np.int64(1), np.int64(0)), np.int64(6), 100),
 ((np.int64(8), np.int64(2), np.int64(2)), np.int64(6), 100),
 ((np.int64(9), np.int64(0), np.int64(2)), np.int64(6), 100),
 ((np.int64(9), np.int64(1), np.int64(2)), np.int64(6), 100)]
# also possible for a 2d grid
mask2d = ds["da2"] == ds["da2"][0, 0]
reclist1 = nlmod.grid.da_to_reclist(
    ds, mask2d, col1=ds["da1"][0], col2="da2", layer=0, only_active_cells=True
)
reclist1
[((0, np.int64(1), np.int64(0)), np.int64(3), np.int64(2))]
First active_layer
Use first_active_layer=True to add the first active layer to the reclist. The first active layer is obtained from the idomain.
# create a reclist with col1 (str), col2 (DataArray), col3 (int)
reclist4 = nlmod.grid.da_to_reclist(
    ds, mask2d, col1="da2", col2="da3", first_active_layer=True
)
reclist4
[((np.int64(1), np.int64(0), np.int64(0)), np.int64(2), np.int64(6)),
 ((np.int64(0), np.int64(1), np.int64(0)), np.int64(2), np.int64(6))]
Reclist columns
The col1, col2 and col3 arguments specify what data should be put into the reclist. The types can be str,xarray.DataArray,None or other. If the value is a str the corresponding DataArray from the Dataset is used to get data for the reclist. If the value is an xarray.DataArray the DataArray is used. If the value is None the column is not added to the reclist and if the value is another type that value is used for every record in the reclist.
Be aware that if mask is a 3d array, and the DataArrays of the column should also be 3d.
# create a reclist with col1 (str), col2 (DataArray), col3 (int)
idomain = nlmod.layers.get_idomain(ds)
reclist5 = nlmod.grid.da_to_reclist(
    ds, mask3d, col1=idomain, col2="da1", col3=9, layer=0, only_active_cells=False
)
reclist5
[((np.int64(0), np.int64(0), np.int64(0)), np.int64(0), np.int64(6), 9),
 ((np.int64(0), np.int64(2), np.int64(0)), np.int64(1), np.int64(6), 9),
 ((np.int64(0), np.int64(2), np.int64(1)), np.int64(1), np.int64(6), 9),
 ((np.int64(1), np.int64(2), np.int64(2)), np.int64(1), np.int64(6), 9),
 ((np.int64(2), np.int64(0), np.int64(0)), np.int64(1), np.int64(6), 9),
 ((np.int64(2), np.int64(2), np.int64(1)), np.int64(1), np.int64(6), 9),
 ((np.int64(3), np.int64(2), np.int64(0)), np.int64(1), np.int64(6), 9),
 ((np.int64(6), np.int64(2), np.int64(2)), np.int64(1), np.int64(6), 9),
 ((np.int64(7), np.int64(0), np.int64(0)), np.int64(1), np.int64(6), 9),
 ((np.int64(7), np.int64(1), np.int64(0)), np.int64(1), np.int64(6), 9),
 ((np.int64(8), np.int64(2), np.int64(2)), np.int64(1), np.int64(6), 9),
 ((np.int64(9), np.int64(0), np.int64(2)), np.int64(1), np.int64(6), 9),
 ((np.int64(9), np.int64(1), np.int64(2)), np.int64(1), np.int64(6), 9)]
Vertex model to reclist
# add some random DataArray to the vertex dataset
da_vert = rng.integers(0, 10, (dsv["area"].shape))
dsv["da_vert"] = ("icell2d"), da_vert

# create rec list from a vertex dataset
mask_vert = dsv["da_vert"] == dsv["da_vert"][0]
reclist6 = nlmod.grid.da_to_reclist(
    dsv, mask_vert, col1="da_vert", col2=2330, only_active_cells=False
)
reclist6
[((0, np.int64(0)), np.int64(3), 2330), ((0, np.int64(1)), np.int64(3), 2330)]