Building a groundwater model from scratch
This notebook shows how to build a basic model from scratch using nlmod.
import flopy as fp
import pandas as pd

import nlmod
nlmod.util.get_color_logger("INFO")
nlmod.show_versions()
Python version     : 3.11.14
NumPy version      : 2.4.4
Xarray version     : 2026.4.0
Matplotlib version : 3.10.9
Flopy version      : 3.10.0

nlmod version      : 0.11.3dev
Model parameters
extent = [-500, 500, -500, 500]

top = 0.0
botm = [-10, -15, -30]

kh = [10, 0.1, 20]
kv = [0.5 * k for k in kh]

dx = 10.0
dy = 10.0
Create model dataset
ds = nlmod.get_ds(
    extent,
    delr=dx,
    delc=dy,
    top=top,
    botm=botm,
    kh=kh,
    kv=kv,
    model_ws="00_model_from_scratch",
    model_name="from_scratch",
)
ds
INFO:nlmod.dims.base.to_model_ds:resample layer model data to structured modelgrid
<xarray.Dataset> Size: 882kB
Dimensions:      (y: 100, x: 100, layer: 3)
Coordinates:
  * y            (y) float64 800B 495.0 485.0 475.0 ... -475.0 -485.0 -495.0
  * x            (x) float64 800B -495.0 -485.0 -475.0 ... 475.0 485.0 495.0
  * layer        (layer) int64 24B 0 1 2
    spatial_ref  int64 8B 0
Data variables:
    top          (y, x) float64 80kB 0.0 0.0 0.0 0.0 0.0 ... 0.0 0.0 0.0 0.0 0.0
    botm         (layer, y, x) float64 240kB -10.0 -10.0 -10.0 ... -30.0 -30.0
    kh           (layer, y, x) float64 240kB 10.0 10.0 10.0 ... 20.0 20.0 20.0
    kv           (layer, y, x) float64 240kB 5.0 5.0 5.0 5.0 ... 10.0 10.0 10.0
    area         (y, x) float64 80kB 100.0 100.0 100.0 ... 100.0 100.0 100.0
Attributes:
    extent:      [-500, 500, -500, 500]
    gridtype:    structured
    model_name:  from_scratch
    mfversion:   mf6
    created_on:  20260513_15:10:28
    exe_name:    /home/docs/checkouts/readthedocs.org/user_builds/nlmod/envs/...
    model_ws:    00_model_from_scratch
    figdir:      00_model_from_scratch/figure
    cachedir:    00_model_from_scratch/cache
transport: 0Set time discretisation
ds = nlmod.time.set_ds_time(ds, time=pd.Timestamp.today(), start=1)
Start building model
sim = nlmod.sim.sim(ds)
tdis = nlmod.sim.tdis(ds, sim)
ims = nlmod.sim.ims(sim, complexity="SIMPLE")
gwf = nlmod.gwf.gwf(ds, sim)
dis = nlmod.gwf.dis(ds, gwf)
npf = nlmod.gwf.npf(
    ds, gwf, save_flows=True, save_specific_discharge=True, save_saturation=True
)
ic = nlmod.gwf.ic(ds, gwf, starting_head=1.0)
oc = nlmod.gwf.oc(ds, gwf, save_head=True)
INFO:nlmod.sim.sim.sim:creating mf6 SIM
INFO:nlmod.sim.sim.tdis:creating mf6 TDIS
INFO:nlmod.sim.sim.ims:creating mf6 IMS
INFO:nlmod.gwf.gwf.gwf:creating mf6 GWF
INFO:nlmod.gwf.gwf._dis:creating mf6 DIS
INFO:nlmod.gwf.gwf.npf:creating mf6 NPF
INFO:nlmod.gwf.gwf.ic:creating mf6 IC
INFO:nlmod.gwf.gwf.ic:adding 'starting_head' data array to ds
INFO:nlmod.gwf.gwf.oc:creating mf6 OC
Add wells
wells = pd.DataFrame(columns=["x", "y", "top", "botm", "Q"], index=range(2))
wells.index.name = "well no."
wells.loc[0] = 100, -50, -5, -10, -100.0
wells.loc[1] = 200, 150, -20, -30, -300.0
wells
| x | y | top | botm | Q | |
|---|---|---|---|---|---|
| well no. | |||||
| 0 | 100 | -50 | -5 | -10 | -100.0 |
| 1 | 200 | 150 | -20 | -30 | -300.0 |
wel = nlmod.gwf.wells.wel_from_df(wells, gwf)
Intersecting with grid:   0%|          | 0/2 [00:00<?, ?it/s]
Intersecting with grid: 100%|██████████| 2/2 [00:00<00:00, 191.68it/s]
Add river
xyriv = [
    (250, -500),
    (300, -300),
    (275, 0),
    (200, 250),
    (175, 500),
]

riv_layer = 0  # add to first layer

bed_resistance = 0.1  # days
riv_cond = dx * dy / bed_resistance  # conductance
riv_stage = 1.0  # m NAP
riv_botm = -3.0  # m NAP
riv_data = nlmod.gwf.surface_water.rivdata_from_xylist(
    gwf, xyriv, riv_layer, riv_stage, riv_cond, riv_botm
)

riv = fp.mf6.ModflowGwfriv(gwf, stress_period_data={0: riv_data})
Write and run Simulation
nlmod.sim.write_and_run(sim, ds, silent=True)
INFO:nlmod.sim.sim.write_and_run:write model dataset to cache
INFO:nlmod.sim.sim.write_and_run:write modflow files to model workspace
INFO:nlmod.sim.sim.write_and_run:run model
Load heads
head = nlmod.gwf.get_heads_da(ds)
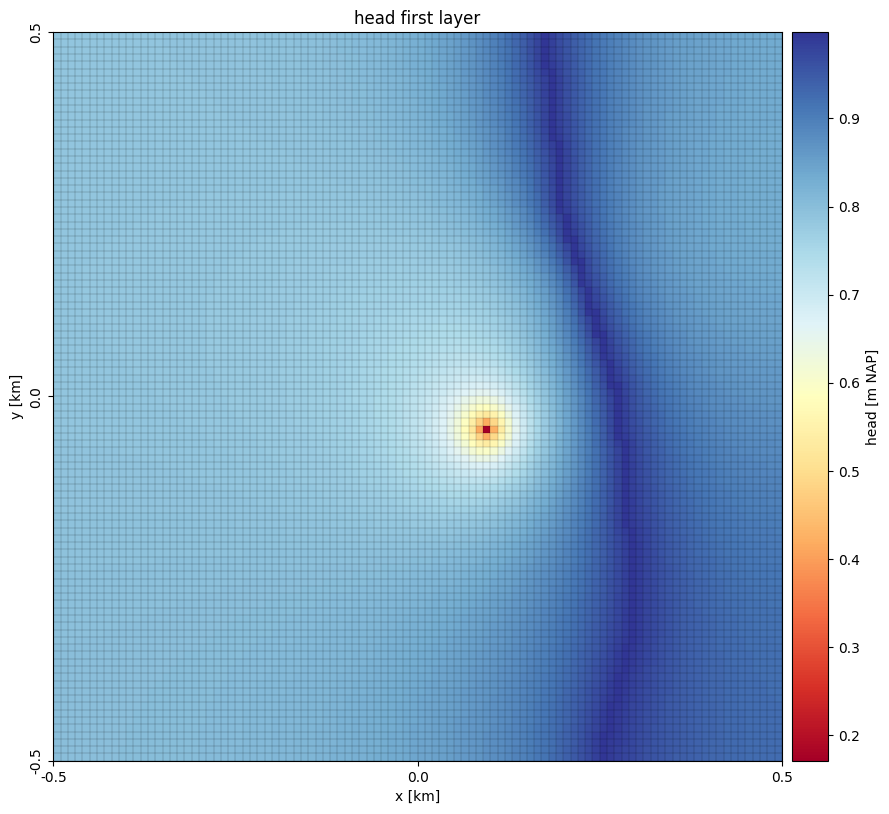
Plot heads
# using nlmod plotting methods
ax = nlmod.plot.map_array(
    head.sel(layer=0).isel(time=0),
    ds,
    cmap="RdYlBu",
    colorbar_label="head [m NAP]",
    xlabel="x [km]",
    ylabel="y [km]",
    title="head first layer",
    plot_grid=True,
)
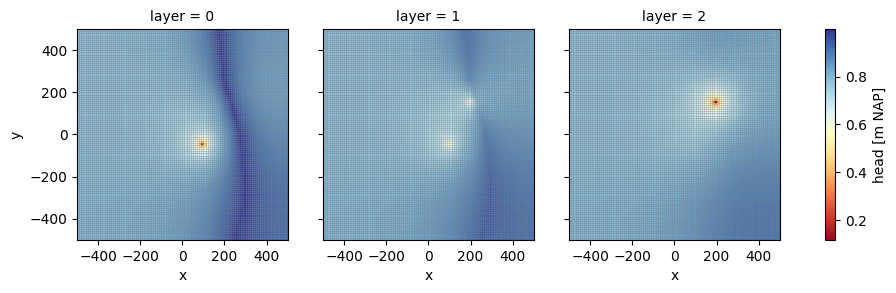
Plot heads in all layers
# using xarray plotting methods
fg = head.plot(
    x="x",
    y="y",
    col="layer",
    col_wrap=3,
    cmap="RdYlBu",
    subplot_kws={"aspect": "equal"},
    cbar_kwargs={"label": "head [m NAP]"},
)

for iax in fg.axs.flat:
    nlmod.plot.modelgrid(ds, ax=iax, alpha=0.5, lw=0.5)